Previous: Causal intervention
I’m feeling a bit uninspired today, so what I am going to do is take the path of least resistance. Instead of giving a thoughtful discussion of the merits and faults of the slogan “Correlation does not imply causation”, I’ll just disprove it with a counterexample.
We have some condition C. This condition affects some members of our population. We want to know if gender (A) and race (B) play a causal role in the incidence of this condition.
Some starting causal assumptions: Gender does not cause race. Race does not cause gender. And the condition does not cause either gender or race.
First we go search for numbers to determine possible correlations between gender and the condition or race and the conditions. Here’s what we find:
P(A & B & C) = 2%
P(A & B & ~C) = 3%
P(A & ~B & C) = 18%
P(A & ~B & ~C) = 27%
P(~A & B & C) = 0.5%
P(~A & B & ~C) = 4.5%
P(~A & ~B & C) = 4.5%
P(~A & ~B & ~C) = 40.5%
Alright, now what are the possible causal structures of race, gender, and condition consistent with our starting assumptions? There are 4: neither A nor B cause C, only B causes C, only A causes C, and both cause C.
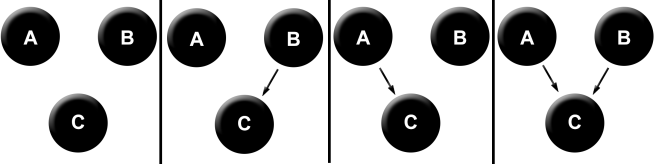
Each of these causal models makes precise, empirical predictions about what sort of correlations we should expect to find. The first model tells us not to expect any correlations whatsoever – each of the variables should vary independently in the population. The second says that A and C will be independent, and B and C will not be. Etc.
We can test all of these straightforwardly: Is it true that P(A & C) = P(A) * P(C)? And is it true that P(B & C) = P(B) * P(C)? We calculate:
P(A & C) = 2% + 18% = 20%
P(B & C) = 2% + .5% = 2.5%
P(A) = 2% + 3% + 18% + 27% = 50%
P(B) = 2% + 3% + .5% + 4.5% = 10%
P(C) = 2% + 18% + .5% + 4.5% = 25%
P(A) * P(C) is 12.5%, and P(B) * P(C) is 2.5%.
So… our third model is correct! We have determined causation from correlation! So much for the famous slogan.
***
The studious one will object that the only way that we have determined causation from correlation in this case is because we started with causal assumptions. This is correct, at least in part. If we had started with no causal assumptions, we still would have found that race and gender are independent. But we would not have been able to determine the direction of our causal arrows.
Here’s a general principle: Purely observational data (read: correlations) cannot tell you on its own the direction of causation. Even this is not actually fully correct: in fact there are special situations called natural experiments in which purely observational data can tell you the direction of causation. We’ll save this discussion for later.
Another studious reader will object: But this is a threadbare notion of causation! On this view, causation is really just statistical dependence!
They are wrong. A causal diagram tells you two things. First, it tells you what correlations you should expect to observe in observational data. But second, it tells you what to expect when you intervene and perform experiments on your variables. This second feature packs in the rest of the intuitive substance of causality.
One final skeptic will point out: Even if we accept your causal assumptions, we cannot truly say that we have ruled out all other causal models. For instance, what if gender does not actually cause the condition, but both gender and the condition are the result of some hidden common cause? This new causal diagram is not ruled out by the data, as one still expects to see a correlation between gender and condition.
They are correct. I am being a little sly in ignoring these subtleties, but this is because they avoid the main point. Which is that causal diagrams are empirically falsifiable, even from purely correlational data. The sense in which the slogan “Correlation does not imply causation” is correct is the sense in which not literally every possible causal model can be eliminated just by observations of correlation. Some causal diagrams truly are empirically indistinguishable. But this doesn’t make causality any more mysterious or un-probeable with the scientific method. We can simply run experiments to deal with the remaining possibilities.
Here are three general ways that you can falsify causal diagrams:
- Through observations of correlation or lack of correlation between variables.
- Through relevant background information (like temporal order or impossibility of physical interaction between variables)
- Through experimental interventions, in which you fix some variables and observe what happens to the others.
Next we’ll discuss some of the useful conceptual tools that arise from this notion of causality.
Previous: Causal intervention

4 thoughts on “Correlation and causation”