Entropy is expected surprise

Today we’re going to talk about a topic that’s very close to my heart: entropy. We’ll start somewhere that might seem unrelated: surprise.

Suppose that we wanted to quantify the intuitive notion of surprise. How should we do that?

We’ll start by analyzing a few base cases.

First! If something happens and you already were completely certain that it would happen, then you should completely unsurprised.

That is, if event E happens, and you had a credence P(E) = 100% in it happening, then your surprise S should be zero.

S(1) = 0

Second! If something happens that you were totally sure was impossible, with 100% credence, then you should be infinitely surprised.

That is, if E happens and P(E) = 0, then S = ∞.

S(0) = ∞

So far, it looks like your surprise S should be a function of your credence P in the event you are surprised at. That is, S = S(P). We also have the constraints that S(1) = 0 and S(0) = ∞.

There are many candidates for a function like this, for example: S(P) = 1/P – 1, S(P) = -log(P), S(P) = cot(πx/2). So we need more constraints.

Third! If an event E1 happens that is surprising to degree S1, and then another event E2 happens with surprisingness S2, then your surprise at the combination of these events should be S1 + S2.

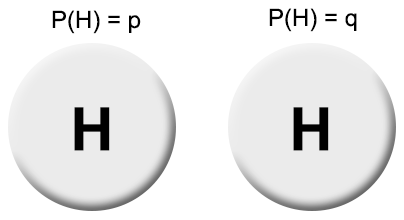
I.e., we want surprise to be additive. If S(P(E1)) = S1 and S(P(E2 | E1)) = S2, then S(P(E1 & E2) = S1 + S2.

This entails a new constraint on our surprise function, namely:

S(PQ) = S(P) + S(Q)

Fourth, and finally! We want our surprise function to be continuous – free from discontinuous jumps. If your credence that the event will happen changes by an arbitrarily small amount, then your surprise if it does happen should also change by an arbitrarily small amount.

S(P) is continuous.

These four constraints now fully specify the form of our surprise function, up to a multiplicative constant. What we find is that the only function satisfying these constraints is the logarithm:

S(P) = k logP, where k is some negative number

Taking the simplest choice of k, we end up with a unique formalization of the intuitive notion of surprise:

S(P) = – logP

To summarize what we have so far: Four basic desideratum for our formalization of the intuitive notion of surprise have led us to a single simple equation.

This equation that we’ve arrived at turns out to be extremely important in information theory. It is, in fact, just the definition of the amount of information you gain by observing E. This reveals to us a deep connection between surprise and information. They are in an important sense expressing the same basic idea: more surprising events give you more information, and unsurprising events give you little information.

Let’s get a little better numerical sense of this formalization of surprise/information. What does a single unit of surprise or information mean? With some quick calculation, we see that a single unit of surprise, or bit of information corresponds to the observation of an event that you had a 50% expectation of. This also corresponds to a ruling out of 50% of the weight of possible other events you thought you might have observed. In essence, each bit of information you receive / surprise you experience corresponds to the total amount of possibilities being cut in half.

Two bits of information narrow the possibilities to one-fourth. Three cut out all but one-eighth. And so on. For a rational agent, the process of receiving more information or of being continuously surprised is the process of whittling down your models of reality to a smaller and better set!

The next great step forward is to use our formalization of surprise to talk not just about how surprised you are once an event happens, but how surprised you expect to be. If you have a credence of P in an event happening, then you expect a degree of surprise S(P) with credence P. In other words, the expected surprise you have with respect to that particular event is:

Expected surprise = – P logP

When summed over the totality of all possible events that occurred we get the following expression:

Total expected surprise = – ∑i Pi logPi

This expression should look very very familiar to you. It’s one of the most important quantities humans have discovered…

ENTROPY!!

Now you understand the title of this post. Quite literally, entropy is total expected surprise!

Entropy = Total expected surprise

By the way, you might be wondering if this is the same entropy as you hear mentioned in the context of physics (that thing that always increases). Yes, it is identical! This means that we can describe the Second Law of Thermodynamics as a conspiracy by the universe to always be as surprising as possible to us! There are a bunch of ways to explore the exact implications of this, but that’s a subject for another post.

Getting back to the subject of this post, we can now make another connection. Surprise is information. Total expected surprise is entropy. And entropy is a measure of uncertainty.

If you think about this for a moment, this should start to make sense. If your model of reality is one in which you expect to be very surprised in the next moment, then you are very uncertain about what is going to happen in the next moment. If, on the other hand, your model of reality is one in which you expect zero surprise in the next moment, then you are completely certain!

Thus we see the beautiful and deep connection between surprise, information, entropy, and uncertainty. The overlap of these four concepts is rich with potential for exploration. We could go the route of model selection and discuss notions like mutual informationinformation divergence, and relative entropy, and how they relate to the virtues of predictive accuracy and model simplicity. We could also go the route of epistemology and discuss the notion of epistemic humility, choosing your beliefs to maximize your uncertainty, and the connection to Bayesian epistemology. Or, most tantalizingly, we could go the route of physics and explore the connection between this highly subjective sense of entropy as surprise/ uncertainty, and the very concrete notion of entropy as a physical quantity that characterizes the thermal properties of systems.

Instead of doing any of these, I’ll do none, and end here in hope that I’ve conveyed some of the coolness of this intersection of philosophy, statistics, and information theory.

Inference as a balance of accommodation, prediction, and simplicity

(This post is a soft intro to some of the many interesting aspects of model selection. I will inevitably skim over many nuances and leave out important details, but hopefully the final product is worth reading as a dive into the topic. A lot of the general framing I present here is picked up from Malcolm Forster’s writings.)

What is the optimal algorithm for discovering the truth? There are many different candidates out there, and it’s not totally clear how to adjudicate between them. One issue is that it is not obvious exactly how to measure correspondence to truth. There are several different criterion that we can use, and in this post, I want to talk about three big ones: accommodation, prediction, and simplicity.
The basic idea of accommodation is that we want our theories to do a good job at explaining the data that we have observed. Prediction is about doing well at predicting future data. Simplicity is, well, just exactly what it sounds like. Its value has been recognized in the form of Occam’s razor, or the law of parsimony, although it is famously difficult to formalize.
Let’s say that we want to model the relationship between the number of times we toss a fair coin and the number of times that it lands H. We might get a data set that looks something like this:
Data

Now, our goal is to fit a curve to this data. How best to do this?

Consider the following two potential curves:

Curve fitting

Curve 1 is generated by Procedure 1: Find the lowest-order polynomial that perfectly matches the data.

Curve 2 is generated by Procedure 2: Find the straight line that best fits the data.

If we only cared about accommodation, then we’ll prefer Curve 1 over Curve 2. After all, Curve 1 matches our data perfectly! Curve 2, on the other hand, is always close but never exactly right.

On the other hand, regardless of how well Curve 1 fits the data, it entirely misses the underlying pattern in the data captured by Curve 2! This demonstrates one of the failure modes of a single-minded focus on accommodation: the problem of overfitting.

We might want to solve in this problem by noting that while Curve 1 matches the data better, it does so in virtue of its enormous complexity. Curve 2, on the other hand, matches the data pretty well, but does so simply. A combined focus on accommodation + simplicity might, therefore, favor Curve 2. Of course, this requires us to precisely specify what we mean by ‘simplicity’, which has been the subject of a lot of debate. For instance, some have argued that an individual curve cannot be said to be more or less simple than a different curve, as just rephrasing the data in a new coordinate system can flip the apparent simplicity relationship. This is a general version of the grue-bleen problem, which is a fantastic problem that deserves talking about in a separate post.

Another way to solve this problem is by optimizing for accommodation + prediction. The over-fitted curve is likely to be very off if you ask for predictions about future data, while the straight line is likely going to do better. This makes sense – a straight line makes better forecasts about future data because it has gotten to the true nature of the underlying relationship.

What if we want to ensure that our model does a good job at predicting future data, but are unable to gather future data? For example, suppose that we lost the coin that we were using to generate the data, but still want to know what model would have done best at predicting future flips? Cross-validation is a wonderful technique that can be used to deal with exactly this problem.

How does it work? The idea is that we randomly split up the data we have into two sets, the training set and the testing set. Then we train our models on the training set (see which curve each model ends up choosing as its best fit, given the training data), and test it on the testing set. For instance, if our training set is just the data from the early coin flips, we find the following:

Curve fitting cross validation
Cross validation

We can see that while the new Curve 2 does roughly as well as it did before, the new Curve 1 will do horribly on the testing set. We now do this for many different ways of splitting up our data set, and in the end accumulate a cross-validation “score”. This score represents the average success of the model at predicting points that it was not trained on.

We expect that in general, models that overfit will tend to do horribly badly when asked to predict the testing data, while models that actually get at the true relationship will tend to do much better. This is a beautiful method for avoiding overfitting by getting at the deep underlying relationships, and optimizing for the value of predictive accuracy.

It seems like predictive accuracy and simplicity often go hand-in-hand. In our coin example, the simpler model (the straight line) was also the more predictively accurate one. And models that overfit tend to be both bad at making accurate predictions and enormously complicated. What is the explanation for this relationship?

One classic explanation says that simpler models tend to be more predictive because the universe just actually is relatively simple. For whatever reason, the actual relationships between different variables in the universe happens to be best modeled by simple equations, not complicated ones. Why? One reason that you could point to is the underlying simplicity of the laws of nature.

The Standard Model of particle physics, which gives rise to basically all of the complex behavior we see in the world, can be expressed in an equation that can be written on a t-shirt. In general, physicists have found that reality seems to obey very mathematically simple laws at its most fundamental level.

I think that this is somewhat of a non-explanation. It predicts simplicity in the results of particle physics experiments, but does not at all predict simple results for higher-level phenomenon. In general, very complex phenomena can arise from very simple laws, and we get no guarantee that the world will obey simple laws when we’re talking about patterns involving 1020 particles.

An explanation that I haven’t heard before references possible selection biases. The basic idea is that most variables out there that we could analyze are likely not connected by any simple relationships. Think of any random two variables, like the number of seals mating at any moment and the distance between Obama and Trump at that moment. Are these likely to be related by a simple equation? Of course!

(Kidding. Of course not.)

The only times when we do end up searching for patterns in variables is when we have already noticed that some pattern does plausibly seem to exist. And since we’re more likely to notice simpler patterns, we should expect a selection bias among those patterns we’re looking at. In other words, given that we’re looking for a pattern between two variables, it is fairly likely that there is a pattern that is simple enough for us to notice in the first place.

Regardless, it looks like an important general feature of inference systems to provide a good balance between accommodation and either prediction or simplicity. So what do actual systems of inference do?

I’ve already talked about cross validation as a tool for inference. It optimizes for accommodation (in the training set) + prediction (in the testing set), but not explicitly for simplicity.

Updating of beliefs via Bayes’ rule is a purely accommodation procedure. When you take your prior credence P(T) and update it with evidence E, you are ultimately just doing your best to accommodate the new information.

Bayes’ Rule: P(T | E) = P(T) ∙ P(E | T) / P(T) 

The theory that receives the greatest credence bump is going to be the theory that maximizes P(E | T), or the likelihood of the evidence given the theory. This is all about accommodation, and entirely unrelated to the other virtues. Technically, the method of choosing the theory that maximizes the likelihood of your data is known as Maximum Likelihood Estimation (MLE).

On the other hand, the priors that you start with might be set in such a way as to favor simpler theories. Most frameworks for setting priors do this either explicitly or implicitly (principle of indifference, maximum entropy, minimum description length, Solomonoff induction).

Leaving Bayes, we can look to information theory as the foundation for another set of epistemological frameworks. These are focused mostly on minimizing the information gain from new evidence, which is equivalent to maximizing the relative entropy of your new distribution and your old distribution.

Two approximations of this procedure are the Akaike Information Criterion (AIC) and the Bayesian Information Criterion (BIC), each focusing on subtly different goals. Both of these explicitly take into account simplicity in their form, and are designed to optimize for both accommodation and prediction.

Here’s a table of these different procedures, as well as others I haven’t mentioned yet, and what they optimize for:

Optimizes for…

Accommodation?

Prediction?

Simplicity?

Maximum Likelihood Estimation

Minimize Sum of Squares

Bayesian Updating

Principle of Indifference

Maximum Entropy Priors

Minimum Message Length

Solomonoff Induction

P-Testing

Minimize Mallow’s Cp

Maximize Relative Entropy

Minimize Log Loss

Cross Validation

Minimize Akaike Information Criterion (AIC)

Minimize Bayesian Information Criterion (AIC)

Some of the procedures I’ve included are closely related to others, and in some cases they are in fact approximations of others (e.g. minimize log loss ≈ maximize relative entropy, minimize AIC ≈ minimize log loss).

We can see in this table that Bayesianism (Bayesian updating + a prior-setting procedure) does not explicitly optimize for predictive value. It optimizes for simplicity through the prior-setting procedure, and in doing so also happens to pick up predictive value by association, but doesn’t get the benefits of procedures like cross-validation.

This is one reason why Bayesianism might be seen as suboptimal – prediction is the great goal of science, and it is entirely missing from the equations of Bayes’ rule.

On the other hand, procedures like cross validation and maximization of relative entropy look like good candidates for optimizing for accommodation and predictive value, and picking up simplicity along the way.

A failure of Bayesian reasoning

Bayesianism does great when the true model of the world is included in the set of models that we are using. It can run into issues, however, when the true model starts with zero prior probability.

We’d hope that even in these cases, the Bayesian agent ends up doing as well as possible, given their limitations. But this paper presents lots of examples of how a Bayesian thinker can go horribly wrong as a result of accidentally excluding the true model from the set of models they are considering. I’ll present one such example here.

Here’s the setup: A fair coin is being repeatedly flipped, while being watched by a Bayesian agent that wants to predict the bias in the coin. This agent starts off with the correct credence distribution over outcomes: they have a 50% credence in it landing heads and a 50% chance of it landing tails.

However, this agent only has two theories available to them:

T1: The coin lands heads 80% of the time.
T2: The coin lands heads 20% of the time.

Even though the Bayesian doesn’t have access to the true model of reality, they are still able to correctly forecast a 50% chance of the coin landing heads by evenly splitting their credences in these two theories. Given this, we’d hope that they wouldn’t be too handicapped and in the long run would be able to do pretty well at predicting the next flip.

Here’s the punchline, before diving into the math: The Bayesian doesn’t do this. In fact, their behavior becomes more and more unreasonable the more evidence they get.

They end up spending almost all of their time being virtually certain that the coin is biased, and occasionally flip-flopping in their belief about the direction of the bias. As a result of this, their forecast will almost always be very wrong. Not only will it fail to converge to a realistic forecast, but in fact, it will get further and further away from the true value on average. And remember, this is the case even though convergence is possible!

Alright, so let’s see why this is true.

First of all, our agent starts out thinking that T1 and T2 are equally likely. This gives them an initially correct forecast:

P(T1) = 50%
P(T2) = 50%

P(H) = P(H | T1) · P(T1) + P(H | T2) · P(T2)
= 80% · 50% + 20% · 50% = 50%

So even though the Bayesian doesn’t have the correct model in their model set, they are able to distribute their credences in a way that will produce the correct forecast. If they’re smart enough, then they should just stay near this distribution of credences in the long run, and in the limit of infinite evidence converge to it. So do they?

Nope! If they observe n heads and m tails, then their likelihood ratios end up moving exponentially with nm. This means that the credences will almost certainly end up very highly uneven.

In what follows, I’ll write the difference in the number of heads and the number of tails as z.

z = n – m

P(n, m | T1) = .8.2m
P(n, m | T2) = .2n .8m

L(n, m | T1) = 4z
L(n, m | T2) = 1/4z

P(T1 | n, m) = 4z / (4z + 1)
P(T2 | n, m) = 1 / (4z + 1)

Notice that the final credences only depend on z. It doesn’t matter if you’ve done 100 trials or 1 trillion, all that matters is how many more heads than tails there are.

Also notice that the final credences are exponential in z. This means that for positive z, P(T1 | n, m) goes to 100% exponentially quickly, and vice versa.

z

0

1 2 3 4 5

6

P(T1|z) 50% 80% 94.12% 98.46% 99.61% 99.90% 99.97%
P(T2|z) 50% 20% 5.88% 1.54% 0.39% .10% 0.03%

The Bayesian agent is almost always virtually certain in the truth of one of their two theories. But which theory they think is true is constantly flip-flopping, resulting in a belief system that is vacillating helplessly between two suboptimal extremes. This is clearly really undesirable behavior for a supposed model of epistemic rationality.

In addition, as the number of coin tosses increases, it becomes less and less likely that z is exactly 0. At N tosses, the average value of z is √N. This means that the more evidence they receive, the further on average they will be from the ideal distribution.

Sure, you can object that in this case, it would be dead obvious to just include a T3: “The coin lands heads 50% of the time.” But that misses the point.

The Bayesian agent had a way out – they could have noticed after a long time that their beliefs were constantly wavering from extreme confidence in T1 to extreme confidence in T2, and seemed to be doing the opposite of converging to reality. They could have noticed that an even distribution of credences would allow them to do much better at predicting the data. And if they had done so, they they would end up always giving an accurate forecast of the next outcome.

But they didn’t, and they didn’t because the model that exactly fit reality was not in their model set. Their epistemic system didn’t allow them the flexibility needed to realize that they needed to learn from their failures and rethink their priors.

Reality is very messy and complicated and rarely adheres exactly to the nice simple models we construct. It doesn’t seem crazily implausible that we might end up accidentally excluding the true model from our set of possible models, and this example demonstrates a way that Bayesian reasoning can lead you astray in exactly these circumstances.

Bayesianism as natural selection of ideas

There’s a beautiful parallel between Bayesian updating of beliefs and evolutionary dynamics of a population that I want to present.

Let’s start by deriving some basic evolutionary game theory! We’ll describe a population as made up of N different genotypes:

(1, 2, 3, …, N)

Each of these genotypes is represented in some proportion of the population, which we’ll label with an X.

Distribution of genotypes in the population X =  (X1, X2, X3, …, XN)

Each of these fractions will in general change with time. For example, if some ecosystem change occurs that favors genotype 1 over the other genotypes, then we expect X1 to grow. So we’ll write:

Distribution of genotypes over time = (X1(t), X2(t), X3(t), …, XN(t))

Each genotype has a particular fitness that represents how well-adjusted it is to survive onto the next generation in a population.

Fitness of genotypes = (f1, f2, f3, …, fN)

Now, if Genotype 1 corresponds to a predator, and Genotype 2 to its prey, then the fitness of Genotype 2 very much depends on the population of Genotype 1 organisms as well its own population. In general, the fitness function for a particular genotype is going to depend on the distribution of all the genotypes, not just that one. This means that we should write each fitness as a function of all the Xis

Fitness of genotypes = (f1(X), f2(X), f3(X), …, fN(X))

Now, what is relevant to the change of any Xi is not the absolute value of the fitness function fi, but the comparison of fi to the average fitness of the entire population. This reflects the fact that natural selection is competitive. It’s not enough to just be fit, you need to be more fit than your neighbors to successfully pass on your genes.

We can find the average fitness of the population by the standard method of summing over each fitness weighted by the proportion of the population that has that fitness:

favg = X1 f1 + X2 f2 + … + XN fN

And since the fitness of a genotype is relative to the average population genotype the change of Xi is proportional to the ratio of f/ favg. In addition, the change of Xi at time t should be proportional to the size of Xat time t (larger populations grow faster than small populations). Here is the simplest equation we could write with these properties:

Xi(t + 1) = Xi(t) · f/ favg

This is the discrete replicator equation. Each genotype either grows or shrinks over time according to the ratio of its fitness to the average population fitness. If the fitness of a given genotype is exactly the same as the average fitness, then the proportion of the population that has that genotype stays the same.

Now, how does this relate to Bayesian inference? Instead of a population composed of different genotypes, we have a population composed of beliefs in different theories. The fitness function for each theory corresponds to how well it predicts new evidence. And the evolution over time corresponds to the updating of these beliefs upon receiving new evidence.

Xi(t + 1) → P(Ti | E)
Xi(t) → P(Ti)
fi → P(E | Ti)

What does favg become?

favg = X1 f1 + … + XN fN
becomes
P(E) = P(T1) P(E | T2) + … + P(TN) P(E | TN)

But now our equation describing evolutionary dynamics just becomes identical to Bayes’ rule!

Xi(t + 1) = Xi(t) · f/ favg
becomes
P(Ti | E) = P(Ti) P(E | Ti) / P(E)

This is pretty fantastic. It means that we can quite literally think of Bayesian reasoning as a form of natural selection, where only the best ideas survive and all others are outcompeted. A Bayesian treats their beliefs as if they are organisms in an ecosystem that punishes those that fail to accurately predict what will happen next. It is evolution towards maximum predictive power.

There are some intriguing hints here of further directions for study. For example, the Bayesian fitness function only depended on the particular theory whose fitness was being evaluated, but it could have more generally depended on all of the different theories as in the original replicator equation.

Plus, the discrete replicator equation is only one simple idealized model of patterns of evolutionary change in populations. There is a continuous replicator equation, where populations evolve smoothly as analytic functions of time. There are also generalizations that introduce mutation, allowing a population to spontaneously generate new genotypes and transition back and forth between similar genotypes. Evolutionary graph theory incorporates population structure into the model, allowing for subtleties regarding complex spatial population interactions.

What would an inference system based off of these more general evolutionary dynamics look like? How would it compare to Bayesianism?

Does fine-tuning give evidence for God?

I used to think that the fine-tuning argument was the strongest argument out there for the existence of a creator deity. I was especially impressed by the apparent magnitude of the fine-tuning – Steven Weinberg has stated that the value of the cosmological constant was fine-tuned to one part in 10120.

If one takes a naïve (and as we’ll see, incorrect) Bayesian approach to assessing this as evidence, then it looks like this should serve as an incredible amount of evidence for the existence of a God, enough to totally overwhelm all other possible considerations. Why? Because if there is a God, then we expect fine-tuning, while if not, then the fine-tuning looks incredibly unlikely. Given this, the God explanation should receive a credence bump proportional to 10120 upon updating on the observation of fine-tuning.

As a quick aside before diving into the numbers, there is a lot of dispute about whether or not there even is fine-tuning in our universe. For the purposes of this post, I’m going to ignore all of these disputes, and pretend that there is a strong consensus on this matter. I’ll use Weinberg’s estimate of 10-120 for the fine-tuning of the cosmological constant. I know that this is controversial, but the point I’m making will stand for even this insanely tiny value.

Okay, so let’s first present a formal version of the fine-tuning argument for God.

F = “The universe is fine-tuned for life.”
G = “A creator deity fine-tuned the universe for life.”

O(G | F) = L(F | G) · O(G)
L(F | G) = P(F | G) / P(F | ~G) ≈ 1 / 10-120 = 1200 dB

So O(G | F) = 10120 · O(G)

This uses the odds formulation of Bayes’ rule – look it up if you’re unfamiliar.

This argument says that your credences should be adjusted by a factor of 10120 upon observing the fine-tuning of the universe. In other words, to not be virtually certain that there exists a creator deity that rules the universe after updating on fine-tuning, you’d have to have initially had a credence on the order of 10-120.

Let me point out that 10-120 is a really really small number. It’s virtually impossible to imagine any good reason why you would be justified in having a prior credence on this order of magnitude. Nobody should be that sure about anything. Evidence of a strength of 1200 dB is analogous in strength to a noise that is a quadrillion times more intense than the threshold of human hearing.

So what’s wrong with this argument? In fact, it fails at the first step. In calculating the strength of the evidence, we only considered two possible hypotheses: either God or, if not, then random coincidence. But there are many other options that we have to factor in as well, most famously the multiverse hypothesis.

But even if there are other hypotheses out there, shouldn’t they just all share the benefit of the credence boost? The existence of another hypothesis that made the same prediction shouldn’t count as a penalty, right?

Wrong! Probabilities have to add up to 1, and you can’t have multiple mutually exclusive competing hypotheses that you have virtual certainty about. Whatever happens when you add other hypotheses must be more subtle than that. So let’s calculate using Bayes’ rule!

O(T | E) = L(E | T) · O(T)
L(E | T) = P(E | T) / P(E | ~T)

For each theory T we consider, we have to take into account all other theories in the denominator of our likelihood function L. We’ll want to keep in mind the following identity:

P(B & C) = 0
implies
P(A | B or C) = [P(A | B) P(B) + P(A | C) P(C)] / [P(B) + P(C)]

So, for instance, let’s divide up our explanations of the fine-tuning F into three disjoint categories: (1) random coincidence C, (2) a deistic God G, and (3) all other explanations that are mutually incompatible.

L(F | X) = P(F | X) / P(F | ~X)
= P(F | X) (1 – P(X)) / ∑Y≠PP(F | Y) P(Y)

P(F | C) ≈ 10-120
P(F | G) ≈ 1
P(F | O) ≈ 1

L(F | C) ≈ 10-120
L(F | G) ≈ P(~G) / P(O)
L(F | O) ≈ P(~O) / P(G)

O(C | F) = 10-120 · O(C)
O(G | F) = P(G) / P(O)
O(O | F) = P(O) / P(G)

In the end, what we find is that the “Coincidence” hypothesis has been down-voted completely out of existence, leaving only the “God” hypothesis and the “Other” hypothesis.

And importantly, our final credence in either of these hypotheses is not on the order of magnitude of 1 – 10-120. The final balance depends entirely just on the ratio of prior credences in the two explanations.

Trial Run

Let’s look at two individuals updating on the observation of fine-tuning.

Atheist
P(G) = .01%
P(O) = 50%

Deist
P(G) = 99%
P(O) = 1%

(The exact details of these numbers aren’t that important, just that they’re somewhat qualitatively accurate.) Their final credences will be:

Atheist
P(G | F) = 0.02%
P(O | F) = 99.98%

Deist
P(G | F) = 99%
P(O | F) = 1%

And we see that nobody ends up significantly updating their religious beliefs on the evidence of fine-tuning. The deist held a worldview in which the random coincidence hypothesis was already ruled out, so the observation of fine-tuning doesn’t change anything for them. And the atheists were initially fairly agnostic about whether or not the universe was fine-tuned, but were very confident in the existence of other explanations besides God. As such, the observation of fine-tuning served as a minor increase in their belief in God (+.01%), while they become extremely confident that there must be some other explanation.

Fine-tuning would only serve as strong evidence for you if you were initially very sure that there was a God, but agnostic about if God would have designed the universe to accommodate human life, or if its design was purely random coincidence. Even in this case, the bump in credence you’d receive would be nothing like the massive update that seems apparent from a naïve (and wrong) application of Bayesian reasoning.

Noisy Evidence

Scope insensitivity is a cognitive bias that involves a failure to internalize the true scale of quantities. Some of the most striking and frankly depressing examples of this phenomenon involve altruistic behavior, where people care just as much about a cause regardless of how many lives are concerned. In some cases, increasing numbers of affected people result in decreasing willingness to pay.

This issue arises when quantitative metrics don’t line up with our intuitive metrics – 10 billion doesn’t feel 1000 times larger than 10 million. A solution that might be sometimes possible is to adjust the numerical scale you are dealing with to try to get the true scale to match the intuitive scale.

This is a large part of what I think is great about the notion of evidence as noise.

Humans have scope insensitivity with respect to very large and very small probabilities. 99.99% doesn’t feel that different to us from 99.9999%. But they are extremely different. The amount of evidence required to push you from 99.99% to 99.9999% is the same as the amount of evidence that would have pushed you from 9% to 91%. There is a big difference between 99.99% and 99.9999% in terms of the state of knowledge represented.

The problem is that as the probability approaches 100%, the number looks to us like it is barely budging. This can be fixed by making our scale logarithmic. We do this by first converting our probabilities to odds ratios (so 50% becomes 1:1 odds, 75% becomes 3:1 odds, etc), and then taking a logarithm. This is exactly analogous to the decibel scale for noise, so this is called the decibel (dB) scale for evidence.

Probability of A = P(A)
Odds of A = P(A) / P(~A)
Decibel strength of A = 10 · log10(P(A) / P(~A))

Very strong evidence is very noisy, and weak evidence is silent, barely affecting our beliefs. This is also nice because Bayes’ rule becomes additive:

Posterior Odds Ratio = Likelihood Ratio · Prior Odds Ratio
O(T | E) = L(E | T) · O(T)
becomes…
OdB(T | E) = LdB(E | T) + OdB(T)

If your evidence E is equally likely whether or not the theory T is true, then L(E | T) = 1 and LdB(E | T) = 0. Thus you add 0, and end up with the same odds as you started with.

Theories that are very high or very low in credence are very noisy, while those that are around 50% are silent.

Now what’s the difference between 99.99% and 99.9999%?

99.99% = 9999:1 = 40 dB
99.9999% = 999999:1 = 60 dB

A 20 dB difference in strength of belief is a lot easier to wrap your head around than a 0.0099% difference!

In addition, equally strong evidence always looks equally strong when expressed in dB, while it can look increasingly weak when expressed in probabilities.

For example, imagine that somebody comes up to you and claims to be able to read your mind. To test them, you decide to ask her to tell you what number between 0 and 10 is in your head right now. If she gets this right, then this counts as 10 decibels of evidence for her psychic abilities.

L(correct | psychic) = P(correct | psychic) ÷ P(correct | not psychic)
≈ 100% / 10% = 10

10 log₁₀(10) = 10 dB

So if your previous belief in her psychic abilities was at -50 decibels (100,000:1 odds against), then it should now be at -40 decibels (10,000:1 odds against).

The same calculation would tell you that another successful test would nudge you another +10 dB, from -40 to -30. Extrapolation seems to indicate that you should be pretty much agnostic as to whether or not she is psychic after three more such successful tests, and strong believers after only eight total tests.

Initial strength of belief = -50 dB
First test gives evidence of +10 dB
New strength of belief = -40 dB
Four more tests give total evidence of +40 dB
New strength of belief = 0 dB
Three more tests give total evidence of +30 dB
Final strength of belief = +30 dB (99.9%)

This example actually gets things wrong in a very important way. Eight tests like those that I described is probably not sufficient to establish psychic abilities. This is a little off topic, but is useful to go into as a demonstration of how naive usage of Bayes’ rule can lead you off the rails.

Where we went wrong was in the very first step, in calculating the decibel strength of the evidence.

L(correct | psychic) = P(correct | psychic) ÷ P(correct | not psychic)
≈ 100% / 10% = 10

The presumption behind this calculation is that if she were psychic, then she would almost definitely be able to get the number right (≈ 100%), but if not, then she would have a random shot (10%). But “psychic” and “random” are not the only two theories! For instance, maybe the apparent psychic has actually just figured out a masterful method for reading subtle facial movements to guess at the number being guessed, rather than actually being able to look into your mind.

The face-reading hypothesis seems unlikely, but probably less so than true mind-reading abilities. Let’s give it a decibel score of -20 (corresponding to an initial credence of about 1%). This should barely factor into our initial calculation, so let’s suppose that +10 dB is the actual strength of evidence for psychic abilities.

Now PdB(psychic) goes from -50 dB to -40 dB, and PdB(face-reading) goes from -20 dB to -10 dB. They have both gotten more likely, because they both successfully predicted the outcome! And now for the second test, face-reading should have a bigger effect on the calculation! I’ll skip the algebra and just present the new strengths of evidence for the second test:

L(correct | psychic) = 7 dB
L(correct | face-reading) = 10 dB

Notice that the evidence is now weaker for the “psychic” hypothesis, because it has a more likely competing hypothesis. The evidence is still equally strong for face-reading, on the other hand, because its competing hypothesis (that she is psychic) is still very weak.

So we update again!

Psychic: -40 dB to -33 dB (.05%)
Face-reading: -10 dB to 0 dB (50%)

Now the face-reading hypothesis is 50% – apparently equally likely to be true and false! This will sway the strength of the evidence for the ‘psychic’ hypothesis even more on the third trial:

L(correct | psychic) = 3 dB
L(correct | face-reading) = 10 dB

Now with such a likely alternative explanation, the evidence is even weaker than previously for the psychic hypothesis. After our third trial, our beliefs will update as follows:

Psychic: -33 dB to -30 dB (.1%)
Face-reading: 0 dB to 10 dB (90%)

As you can see, the face-reading hypothesis takes off, while the psychic hypothesis ends up staying stuck around .1%.

I’ll talk more about this in a post tomorrow, in which I show how the exact same simple error in our first argument is being made in fine-tuning arguments for God!

Entropy vs relative entropy

This post is about the relationship between entropy and relative entropy. This relationship is subtle but important – purely maximizing entropy (MaxEnt) is not equivalent to Bayesian conditionalization except in special cases, while maximizing relative entropy (ME) is. In addition, the justifications for MaxEnt are beautiful and grounded in fundamental principles of normative epistemology. Do these justifications carry over to maximizing relative entropy?

To a degree, yes. We’ll see that maximizing relative entropy is a more general procedure than maximizing entropy, and reduces to it in special cases. The cases where MaxEnt gives different results from ME can be interpreted through the lens of MaxEnt, and relate to an interesting distinction between commuting and non-commuting observations.

So let’s get started!

We’ll solve three problems: first, using MaxEnt to find an optimal distribution with a single constraint C1; second, using MaxEnt to find an optimal distribution with constraints C1 and C2; and third, using ME to find the optimal distribution with C2 given the starting distribution found in the first problem.

Part 1

Problem: Maximize – ∫ P logP dx with constraints
∫ P dx = 1
∫ C1[P] dx = 0

P ( – P1 logP1 + (α + 1) P1 + βC1[P1] ) = 0
– logP1 + α + β C1’[P1] = 0

Part 2

Problem: Maximize – ∫ P logP dx with constraints
∫ P dx = 1
∫ C1[P] dx = 0
∫ C2[P] dx = 0

P ( – P2 logP2 + (α’ + 1) P2 + β’C1[P2] + λ C2[P2] ) = 0
– logP2 + α’ + β’ C1’[P2] + λ C2’[P2] = 0

Part 3

Problem: Maximize – ∫ P log(P / P1) dx with constraints
∫ P dx = 1
∫ C2[P] dx = 0

P ( – P3 logP3 + P3 logP1 + (α’’ + 1)P3 + λ’ C2[P3] ) = 0
– logP3 + α’’ + logP1 + λ’ C2’[P3] = 0
– logP3 + α’’ + α + β C1’[P1] + λ’ C2’[P3] = 0
– logP3 + α’’’ + β C1’[P1] + λ’ C2’[P3] = 0

We can now compare our answers for Part 2 to Part 3. These are the same problem, solved with MaxEnt and ME. While they are clearly different solutions, they have interesting similarities.

MaxEnt
– logP2 + α’ + β’ C1’[P2] + λ C2’[P2] = 0
∫ P2 dx = 1
∫ C1[P2] dx = 0
∫ C2[P2] dx = 0

ME
– logP3 + α’’’ + β C1’[P1] + λ’ C2’[P3] = 0
∫ P3 dx = 1
∫ C1[P1] dx = 0
∫ C2[P3] dx = 0

The equations are almost identical. The only difference is in how they treat the old constraint. In MaxEnt, the old constraint is treated just like the new constraint – a condition that must be satisfied for the final distribution.

But in ME, the old constraint is no longer required to be satisfied by the final distribution! Instead, the requirement is that the old constraint be satisfied by your initial distribution!

That is, MaxEnt takes all previous information, and treats it as current information that must constrain your current probability distribution.

On the other hand, ME treats your previous information as constraints only on your starting distribution, and only ensures that your new distribution satisfy the new constraint!

When might this be useful?

Well, say that the first piece of information you received, C1, was the expected value of some measurable quantity. Maybe it was that x̄ = 5.

But if the second piece of information C2 was an observation of the exact value of x, then we clearly no longer want our new distribution to still have an expected value of x̄. After all, it is common for the expected value of a variable to differ from the exact value of x.

E(x) vs x

Once we have found the exact value of x, all previous information relating to the value of x is screened off, and should no longer be taken as constraints on our distribution! And this is exactly what ME does, and MaxEnt fails to do.

What about a case where the old information stays relevant? For instance, an observation of the values of a certain variable is not ‘cancelled out’ by a later observation of another variable. Observations can’t be un-observed. Does ME respect these types of constraints?

Yes!

Observations of variables are represented by constraints that set the distribution over those variables to delta-functions. And when your old distribution contains a delta function, that delta function will still stick around in your new distribution, ensuring that the old constraint is still satisfied.

Pold ~ δ(x – x’)
implies
Pnew ~ δ(x – x’)

The class of observations that are made obsolete by new observations are called non-commuting observations. They are given this name because for such observations, the order in which you process the information is essential. Observations for which the order of processing doesn’t matter are called commuting observations.

In summation: maximizing relative entropy allows us to take into account subtle differences in the type of evidence we receive, such as whether or not old data is made obsolete by new data. And mathematically, maximizing relative entropy is equivalent to maximizing ordinary entropy with whatever new constraints were not included in your initial distribution, as well as an additional constraint relating to the value of your old distribution. While the old constraints are not guaranteed to be satisfied by your new distribution, the information about them is preserved in the form of the prior distribution that is a factor in the new distribution.

Fun with Akaike

The Akaike information criterion is a metric for model quality that naturally arises from the principle of maximum entropy. It balances predictive accuracy against model complexity, encoding a formal version of Occam’s razor and solving problems of overfitting. I’m just now learning about how to use this metric, and will present a simple example that shows off a lot of the features of this framework.

Suppose that we have two coins. For each coin, we can ask what the probability is of each coin landing heads. Call these probabilities p and q.

Akaike.png

Two classes of models are (1) those that say that p = q and (2) those that say that p ≠ q. The first class of models are simpler in an important sense – they can be characterized by a single parameter p. The second class, on the other hand, require two separate parameters, one for each coin.

The number of parameters (k) used by our model is one way to measure model complexity. But of course, we can also test our models by getting experimental data. That is, we can flip each coin a bunch of times, record the results, and see how they favor one model over another.

One common way of quantifying the empirical success of a given model is by looking at the maximum value of its likelihood function L. This is the function that tells you how likely your data was, given a particular model. If Model 2 can at best do better at predicting the data than Model 1, then this should count in favor of Model 2.

So how do we combine these pieces of information – k (the number of parameters in a model) and L (the predictive success of the model)? Akaike’s criterion says to look at the following metric:

AIK = 2k – 2 lnL

The smaller the value of this parameter, the better your model is.

So let’s apply this on an arbitrary data set:

n1 = number of times coin 1 landed heads
n2 = number of times coin 1 landed tails
m1 =number of times coin 2 landed heads
m2 = number of times coin 2 landed tails

For convenience, we’ll also call the total flips of coin 1 N, and the total flips of coin 2 M.

First, let’s look at how Model 1 (the one that says that the two coins have an equal chance of landing heads) does on this data. This model predicts with probability p each heads, on either coin, and with probability 1 – p each tails on either coin.

L1 = C(N,n1) C(M,m1) pn1+m1 (1 – p)n2+m2

The two choose functions C(N, n1) and C(M, m1) are there to ensure that this function is nicely normalized. Intuitively, they arise from the fact that any given number of coin tosses that land heads could happen in many possible, ways, and all of these ways must be summed up.

This function finds its peak value at the following value of p:

p = (n1 + m1) / (N + M)
L1,max = C(N, n1) C(M, m1) (n1 + m1)n1+m1 (n2 + m2)n2+m2 / (N + M)N+M

By Stirling’s approximation, this becomes:

ln(L1,max) ~ -ln(F) – ½ ln(G)
where F = (N + M)N+M/NNMM · n1n1m1m1/(n1 + m1)n1+m1 · n2n2m2m2/(n2 + m2)n2+m2
and G = n1n2m1m/ NM

With this, our Akaike information criterion for Model 1 tells us:

AIC= 2 + 2ln(F) + ln(G)

Moving on to Model 2, we now have two different parameters p and q to vary. The likelihood of our data given these two parameters are given by:

L2 = C(N, n1) C(M, m1) pn1 (1 – p)n2 qm1 (1 – q)m2

The values of p and q that make this data most likely are:

p = n1 / N
q = m1 / M
So L2,max = C(N, n1) C(M, m1) n1n1m1m1n2n2m2m2 / NNMM

And again, using Stirling’s approximation, we get:

ln(L1,max) ~  – ½ ln(G)
So AIC= 4 + ln(G)

We now just need to compare these two AICs to see which model is preferable for a given set of data:

AIC= 4 + ln(G)
AIC= 2 + 2ln(F) + ln(G)

AIC– AIC= 2 – 2lnF

Let’s look at two cases that are telling. The first case will be that we find that both coin 1 and coin 2 end up landing heads an equal proportion of the time, and for simplicity, both coins are tossed the same number of times. Formally:

Case 1: N = M, n1 = m1, n2 = m2

In this case, F becomes 1, so lnF becomes 0.

AIC– AIC1 = 2 > 0
So Model 1 is preferable.

This makes sense! After all, if the two coins are equally likely to land heads, then our two models do equally well at predicting the data. But Model 1 is simpler, involving only a single parameter, so it is preferable. AIC gives us a precise numerical criterion by which to judge how preferable Model 1 is!

Okay, now let’s consider a case where coin 1 lands heads much more often than coin 2.

Case 2: N = M, n1 = 2m1, 2n2 = m2

Now if we go through the algebra, we find:

F = 4N (4/27)(m1+n2) ~ 1.12N
So lnF ~ N ln(1.12) ~ .11 N
So AIC– AIC1 = 2 – .22N

This quantity is larger than 0 when N is less than 10, but then becomes smaller than zero for all other values.

Which means that for Case 2, small enough data sets still allow us to go with Model 1, but as we get more data, the predictive accuracy of Model 2 eventually wins out!

It’s worth pointing out here that the Akaike information criterion is an approximation to the technique of maximizing relative entropy, and this approximation assumes large sets of data. Given this, it’s not clear how reliable our estimate of 10 is for the largest data set.

Let’s do one last thing with our simple models.

As our two coins become more and more similar in how often they land heads, we expect Model 1 to last longer before Model 2 ultimately wins out. Let’s calculate a general relationship between the similarity in the ratios of heads to tails in coin 1 and coin 2 and the amount of time it takes for Model 1 to lose out.

Case 3: N = M, n1 = r·m1, r·n2 = m2

r here is our ratio of p/q – the chance of heads in coin 1 over the chance of heads in coin 2. Skipping ahead through the algebra we find:

lnF = N ln( 2 rr/(r+1) / (r + 1) )

Model 2 becomes preferable to Model 1 when AICbecomes smaller than AIC1, so we can find the critical point by setting ∆AIC = 2 – 2 lnF = 0

lnF = N ln( 2 rr/(r + 1) / (r + 1) ) = 1
N = 1 / ln( 2 rr/(r + 1) / (r + 1) )

We can see that as r goes to 1, N goes to ∞. We can see how quickly this happens by doing some asymptotics:

r = 1 + ε
N ~ 1 / ln(1 + ε)
So ε ~ e1/N – 1

N goes to infinity at an exponential rate as r approaches 1 linearly. This gives us a very rough idea of how similar our coins must be for us to treat them as essentially identical. We can use our earlier result that at r = 2, N = 10 to construct a table:

r N
2 10
1.1 100
1.01 1000
1.001 10,000
1.0001 100,000

Anthropic argument for common priors

(Idea from Robin Hanson and Tyler Cowen’s 2004 paper Are Disagreements Honest?)

One common argument relating to common priors is that two rational agents with all the same information (including no information at all) could have no possible grounds on which to disagree. Priors by definition refer to the state of knowledge before either agent had any evidence relevant to a given proposition. So there is no information that either agent could have that would allow a difference in priors.

A response to this is that some information that we have is inherently private and unique to us. For instance, you and I might have differences in intelligence, in ways of conceptualizing the world, or in the things we innately find intuitively plausible. All of these differences may count as important information in shaping our priors on a given subject, before we ever encounter a single piece of evidence relevant to the subject.

Here’s a really weird argument for why even these differences should not count. If we use anthropic reasoning, and treat our own existence and the details of our brain and body as just another thing to be conditioned on, then even these private intimate details are simply contingent facts about the world that are to be treated as evidence. Before you’ve conditioned on your own existence, you should be agnostic as to which set of brain/body/mind out of all the possible sets of observers “you” will end up being. You must imagine yourself behind Rawls’ veil of ignorance, a disembodied reasoner that is identical to all other such reasoners. So there is no conceivable reason why your prior should differ from anybody else’s – you must treat yourself as literally the same entity as them pre anthropic conditioning.

In less out-there terms, if you encounter somebody with an apparently different prior from you, then you should consider “Hmm, what if I were born as this person, instead of myself?” The answer to which is, of course, you would have had the same priors as them. Which means that your difference in “priors” is actually a difference of posteriors resulting from conditioning on the arbitrary choice of body/brain/experiences you ended up with.

In addition, by Aumann’s agreement theorem, any apparent differences in priors that become common knowledge should quickly go away, once they are realized to be merely differences in posteriors. Essentially, any differences in priors that last between two rational individuals are signs that they are arbitrarily favoring their own existence in considerations of what prior they should use.

Why you should be a Bayesian

In this post, I take Bayesianism to be the following normative epistemological claim: “You should treat your beliefs like probabilities, and reason according to the axioms of probability theory.”

Here are a few reasons why I support this claim:

I. Logic is not enough

Reasoning deductively from premises to conclusion is a wonderfully powerful tool when it can be applied. If you have absolute certainty in some set of premises, and these premises entail a new conclusion, then you can extend your certainty to the new conclusion. Alternatively, you can state clearly the conditions under which you would be granted certain belief, in the form of a conditional argument (if you were to convince me that A and B are true, then I would believe that C is true).

This is great for mathematicians proving theorems about abstract logical entities. But in the real world, deductive inference is simply not enough to account for the types of problems we face. We are constantly reasoning in a condition of uncertainty, where we have multiple competing theories about what’s going on, and we seek evidence – partial evidence, not deductively complete evidence – as to which of these theories we should favor.

If you want to know how to form beliefs about the parts of reality that aren’t clear-cut and certain, then you need to go beyond pure logic.

II. Probability theory is a natural extension of logic

Cox’s theorem shows that any system of plausible reasoning – modifying and updating beliefs in the presence of uncertainty – that is consistent with logic and a few minimal assumptions about normative reasoning is necessarily isomorphic to probability theory.

The converse of this is that any system of reasoning under uncertainty that isn’t ultimately functionally equivalent to Bayesianism is either logically inconsistent or violates other common-sense axioms of reasoning.

In other words, probability theory is the best candidate that we have for extending logic into the domain of the uncertain. It is about what is likely, not certain, to be true, and the way that we should update these assessments when receiving new information. In turn, probability theory contains ordinary logic as a special case when you take the limit of absolutely certainty.

III. Non-Bayesian systems of plausible reasoning result in inconsistencies and irrational behavior

Dutch-book arguments prove that any agent that is violating the axioms of probability theory can be exploited by cleverly capitalizing on logical inconsistencies in their beliefs. This combines a pragmatic argument (non-Bayesians are worse off in the long run) with an epistemic argument (non-Bayesians are vulnerable to logical inconsistencies in their preferences).

IV. You should be honest about your uncertainty

The principle of maximizing entropy mandates a unique way to set beliefs given your evidence, such that you make no presumptions about knowledge that you don’t have. This principle is fully consistent with and equivalent to standard Bayesian conditionalization.

In other words, Bayesianism is about epistemic humility – it tells you to not pretend to know things that you don’t know.

V. Bayesianism provides the foundations for the scientific method

The scientific method, needless to say, is humanity’s crowning epistemic achievement. With it we have invented medicine, probed atoms, and gone to the stars. Its success can be attributed to the structure of its method of investigating truth claims: in short, science is about searching theories for testable consequences, and then running experiments to update our beliefs in these theories.

This is all contained in Bayes’ rule, the fundamental law of probabilistic inference:

Pr(theory | evidence) ~ Pr(evidence | theory) · Pr(theory)

This rule tells you precisely how you should update your beliefs given your evidence, no more and no less. It contains the wisdom of empiricism that has revolutionized the world we live in.

VI. Bayesianism is practically useful

So maybe you’re convinced that Bayesianism is right in principle. There’s a separate question of if Bayesianism is useful in practice. Maybe treating your beliefs like probabilities is like trying to do psychology starting from Schrödinger’s equation – possible in principle but practically infeasible, not to mention a waste of time.

But Bayesianism is practically useful.

Statistical mechanics, one of the most powerful branches of modern science, is built on a foundation of explicitly Bayesian principles. More generally, good statistical reasoning is incredibly useful across all domains of truth-seeking, and an essential skill for anybody that wants to understand the world.

And Bayesianism is not just useful for epistemic reasons. A fundamental ingredient of decision-making is the ability to produce accurate models of reality. If you want to effectively achieve your goals, whatever they are, you must be able to engage in careful probabilistic reasoning.

And finally, in my personal experience I have found Bayesian epistemology to be infinitely mineable for useful heuristics in thinking about philosophy, physics, altruism, psychology, politics, my personal life, and pretty much everything else. I recommend anybody whose interest has been sparked to check out the following links: