On complexity and information geometry

AIC and BIC, two of the most important model selection criteria, both penalize overfitting by looking at the number of parameters in a model. While this is a good first approximation to quantifying overfitting potential, it is overly simplistic in a few ways.

Here’s a simple example:

= { y(x) = ax | a ∈ [0, 1] }
= { y(x) = ax | a ∈ [0, 10] }

is contained within ℳ, so we expect that it should be strictly less complex, with lesser overfitting potential, than ℳ₂. But both have the same number of parameters! So the difference between the two will be invisible to AIC and BIC (as well as all other model selection techniques that only make reference to the number of parameters in the model).

A more subtle approach to quantifying complexity and overfitting potential is given by the Fisher information metric. The idea is to define a geometric space over all possible values of the parameter, where distances in this space correspond to information gaps between different distributions.

Imagine a simple two-parameter model:

ℳ = { P(x | a, b) | a, b ∈ ℝ }

We can talk about the information distance between any particular distribution in this model and the true distribution by referencing the Kullback-Leibler divergence:

DKL = ∫ Ptrue(x) log( Ptrue(x) / P(x | a, b)) dx

The optimal distribution in the space of parameters is the distribution for which this quantity is minimized. We can find this by taking the derivative with respect to the parameters and setting it equal to zero:

[DKL] = ∂a [ ∫ Ptrue(x) log( Ptrue(x) / P(x | a, b)) d]
= ∂a [ – ∫ Ptrue(x) log(P(x | a, b)) d]
= – ∫ Ptrue(x) ∂log(P(x | a, b)) d]
= E[ – ∂log(P(x | a, b) ]

[DKL] = E[ – ∂log(P(x | a, b) ]

We can form a geometric space out of DKL by looking at its second derivatives:

aa [DKL] = E[ – ∂aa log(P(x | a, b) ] = gaa
ab [DKL] = E[ – ∂ab log(P(x | a, b) ] = gab
ba [DKL] = E[ – ∂ba log(P(x | a, b) ] = gba
bb [DKL] = E[ – ∂bb log(P(x | a, b) ] = gbb

These four values make up what is called the Fisher information metric . Now, the quantity

ds² = gaa da² + 2 gab da db + gbb db²

defines the information distance between two infinitesimally close distributions. We now have a geometric space, where each point corresponds to a particular probability distribution, and distances correspond to information gaps. All of the nice geometric properties of this space can be discovered just by studying the metric ds². For instance, the volume of any region of this space is given by:

dV = √(det(g)) da db

Now, we are able to see the relevance of all of this to the question of model complexity and overfitting potential. Any model corresponds to some region in this space of distributions, and the complexity of the model can be measured by the volume it occupies in the space defined by the Fisher information metric.

This solves the problem that arose with the simple example that we started with. If one model is a subset of another, then the smaller model will be literally enclosed in the parameter space by the larger one. Clearly, then, the volume of the larger model will be greater, so it will be penalized with a higher complexity.

In other words, volumes in the geometric space defined by Fisher information metric give us a good way to talk about model complexity, in terms of the total information content of the model.

Here’s a quick example:

= { y(x) = ax + b + U | a ∈ [0, 1], b ∈ [0, 10], U a Gaussian error term }
= { y(x) = ax + b + U | a ∈ [-1, 1], b ∈ [0, 100], U a Gaussian error term }

Our two models are represented by a set of gaussians centered around the line ax + b. Both of these models have the same information geometry, since they only differ in the domain of their parameters:

gaa = ∂aa [DKL] = ⅓
gab = ∂ab [DKL] = ½
gba = ∂ba [DKL] = ½
gbb = ∂bb [DKL] = 1

From this, we can define lengths and volumes in the space:

ds² = ⅓ da² + da db + db²
dV = √(det(g)) da db = da db / 2√3

Now we can explicitly compare the complexities of ℳ and ℳ:

C(ℳ) = 5/√3 ≈ 2.9
C(ℳ) = 100/√3 ≈ 53.7

In the end, we find that C(ℳ) > C(ℳ) by a factor of 20. This is to be expected; Model 2 has a 20 times larger range of parameters to search, and is thus 20 times more permissive than Model 1.

While the conclusion is fairly obvious here, using information geometry allows you to answer questions that are far from obvious. For example, how would you compare the following two models? (For simplicity, let’s suppose that the data is generated according to the line y(x) = 1, with x ∈ [0, 1].)

 = { y(x) = ax + b | a ∈ [2, 10], b ∈ [0, 2] }
 = { y(x) = aeᵇˣ | a ∈ [2, 10], b ∈ [0, 2] }

They both have two parameters, but express very different hypotheses about the underlying data. Intuitively, ℳ feels more complex, but how do we quantify this? It turns out that ℳ has the following Fisher information metric:

gaa = ∂aa [DKL] = (2b + 1)-1
gab = ∂ab [DKL] = – (2b + 1)-2
gba = ∂ba [DKL] = – (2b + 1)-2
gbb = ∂bb [DKL] = 4a (2b + 1)-3 – 2 (b + 1)-3

Thus,

dV = (2b + 1)-2 (4a + 1 – (2b+1)3/(b+1)3)½ da db

Combining this with the previously found volume element for ℳ. we find the following:

C(ℳ) ≈ 4.62
C(ℳ₄
) ≈ 14.92

This tells us that ℳ₄ contains about 3 times as much information as ℳ, precisely quantifying our intuition about the relative complexity of these models.

Formalizing this as a model selection procedure, we get the Fisher information approximation (FIA).

FIA  = – log L + k/2 log(N/2π) + log(Volume in Fisher information space)
BIC  = – log L + k/2 log(N/2π)
AIC  = – log L + k
AICc = – logL + k + k ∙ (k+1)/(N – k – 1)

Color coding: Goodness-of-fit DimensionalityComplexity


A note of ambiguity regarding model selection

A model is a family of probability distributions over a set of observable variables X, parameterized by some set of parameters a1, a2, …, ak.

M = { p(X | a1, a2, …, ak) | a1, a2, …, ak }

Models arise naturally when we are unsure about some details of a distribution, but know its general form. For example, maybe we know that the positions of particles in a gas cloud are normally distributed, but don’t know the degree of spread of this cloud or the location of its center. Then we would want to represent the positions of our particles by a Gaussian distribution over all possible positions, parameterized by the mean and variance of the distribution.

Given this model, we can now make observations of particle positions in order to gain information about the spread and center of the gas cloud. In other words, we have split our epistemological task into two questions:

  1. What model is best? (Model selection)
  2. What values of the parameters are best? (Parameter selection)

Parameter selection is generally accomplished by ordinary accommodation procedures. Broadly, these fall into two categories:

  • Likelihood maximization (which parameters make the data most likely?)
  • Posterior maximization (which parameters are made most likely by the data?)

Model selection is where we correct for overfitting and prioritize simplicity. Two common optimization goals are:

  • Minimize information divergence (which model is closest to the truth in information theoretic terms?)
  • Maximize predictive accuracy (which model does the best job at predicting the next data point?)

So to summarize, we decide what to believe by (1) selecting a set of models, (2) optimizing each model to fit our data, and (3) comparing our optimized models using model selection criteria.

Now, while (3) and (2) are perfectly clear to me, (1) seems much less so. How do we decide what set of models we are working with? While this might be easily practically solved by just using a standard set of models, it seems theoretically troubling. One problem is that the space of possible models is incredibly large, and can be divided up in many different ways.

Another problem is that two people that are looking at all the same hypotheses might have apparent disagreements about what models they are using. Let’s look at an example of this. Person A and Person B both are looking at the same hypothesis set: the set of all lines through the origin with a Gaussian measurement error. But they describe their epistemic framework as follows:

Person A: I have a single model, defined by a single parameter: M = { y = ax + U | a ∈ ℝ, U a Gaussian error term }.

Person B: I have an uncountable infinity of models, each defined by zero parameters. Labeling each model with index a ∈ , I can describe the ath model: Ma = { y = ax + U | U a Gaussian error term }.

The difference between these two is clearly purely semantic; both are looking at the same set of hypotheses, but one is considering them to be contained in a single overarching model, and the other is looking at them each individually.

This becomes a problem when we consider the fact that model selection techniques are sensitive to the number of parameters in the model. More parameters = a larger penalty for overfitting. So while Person A will be penalized for having one tweakable parameter, Person B will be free from penalty.

The response that we want to give here is that Person B is really working with a single model in all but name. What we really care about is the ability of an agent to search among a large space of models, with the excessive flexibility that allows them to not only identify trends in data but also to track the noise in the data. And both Person A and Person B have equal flexibility in this regard, so should be penalized accordingly.

We could try to implement this formally by attempting to reduce large sets of models to smaller sets as much as possible. The problem with this is that any set of models can in principle be reduced to a single larger model with additional adjustable parameters.

In general, the problem of how to clearly distinguish between parameters and models seems like a fairly serious issue for any epistemology that fundamentally relies on this distinction.

Gibbs’ inequality

As a quick reminder from previous posts, we can define the surprise in an occurrence of an event E with probability P(E) as:

Sur(P(E)) = log(1/P) = – log(P).

I’ve discussed why this definition makes sense here. Now, with this definition, we can talk about expected surprise; in general, the surprise that somebody with distribution Q would expect somebody with distribution P to have is:

EQ[Sur(P)] = ∫ – Q log(P) dE

This integral is taken over all possible events. A special case of it is entropy, which is somebody’s own expected surprise. This corresponds to the intuitive notion of uncertainty:

Entropy = EP[Sur(P)] = ∫ – P log(P) dE

The actual average surprise for somebody with distribution P is:

Actual average surprise = ∫ – Ptrue log(P) dE

Here we are using the idea of a true probability distribution, which corresponds to the distribution over possible events that best describes the frequencies of each event. And finally, the “gap” in average surprise between P and Q is:

∫ Ptrue log(P/Q) dE

Gibbs’ inequality says the following:

For any two different probability distributions P and Q:
EP[Sur(P)] < EP[Sur(Q)]

This means that out of all possible ways of distributing your credences, you should always expect that your own distribution is the least surprising.

In other words, you should always expect to be less surprised than everybody else.

This is really unintuitive, and I’m not sure how to make sense of it. Say that you think that a coin will either land heads or tails, with probability 50% for each. In addition, you are with somebody (who we’ll call A) that you know has perfect information about how the coin will land.

Does it make sense to say that you expect them to be more surprised about the result of the coin flip than you will be? This seems hardly intuitive. One potential way out of this is that the statement “A knows exactly how the coin will land” has not actually been included in your probability distribution, so it isn’t fair to stipulate that you know this. One way to try to add in this information is to model their knowledge by something like “There’s a 50% chance that A’s distribution is 100% H, and a 50% chance that it is 100% T.”

The problem is that when you average over these distributions, you get a new distribution that is identical to your own. This is clearly not capturing the state of knowledge in question.

Another possibility is that we should not be thinking about the expected surprise of people, but solely of distributions. In other words, Gibb’s inequality tells us that you will expect a higher average surprise for any distribution that you are handed, than for your own distribution. This can only be translated into statements about people‘s average surprise when their knowledge can be directly translated into a distribution.

Some simple visual comparisons of model selection techniques

The goal of model selection is to find a model that provides the best fit to a set of data, without overfitting the data. Different criterion for assessing the degree of overfitting abound; typically they make reference to the number of parameters a model includes. Too few parameters, and your model will not be flexible enough to fit the data. Too many, and your model will be too flexible and end up overfitting the data.

I made a little program that calculates and plots different measures of model quality as a function of the number of parameters in the model, for any choice of true distribution. The models used in this program are all just polynomial fits; the kth model is the set of all (k-1)-order polynomials. I’ll show off some of the resulting plots here!

***

True distribution: y(x) = x2

10 data points

Parabola N=10

100 data points

parabola-n1001.png

1000 data points

parabola-n10001.png

Some things to notice:

  • All three of BIC, AIC, and AICc give the same (and correct) answer, even for a data set of only 10 points.
  • The difference between AICc and AIC becomes pretty much irrelevant for large enough data sets.
  • BIC always penalizes complexity more than AIC
  • The complexity penalty is pretty nearly matched by the improvement in fit for large numbers of parameters, but slightly outweighs it.

True distribution: y = x3/10 + x2 – 10x

10 data points

3rd-order-n10.png

100 data points

3rd-order-n100.png

1000 data points

3rd-order-n1000.png

Now let’s look at an example where the true distribution is not actually in any of the models.

True distribution: y = e-x/2

20 data points

exp-n20.png

100 data points

exp-n100.png

1000 data points

exp-n1000.png

Here we begin to see some disagreement between the different methods! For N=20, AICc would have recommended the optimal model as k = 4 (a third order polynomial), while AIC and BIC both recommended k = 5. In addition, we see that the same method gives different answers as the number of data points rises (5 to 7 to 6 parameters)

Regardless, we still see that all three methods succeed in preventing overfitting, and do a fairly good job at catching the underlying trend in the data. However, the question of which model is optimal becomes a little more ambiguous.

One final example, which we’ll make especially difficult for a polynomial model:

True distribution: y = 10*sin(x)

N = 20

sine-n20.png

N = 100

sine-n100.png

N = 1000

sine-n1000.png

Again we see that all of the model selection criterion give similar answers, and the curves generated nicely align with the true curve. It looks like 11 to 13 order polynomials do a good job at modeling a sine wave on this scale.

It’s interesting to watch the jagged descent of the criteria as you approach the optimal number of parameters from below. For some reason, it looks like adding a single extra parameter is generally unhelpful for this problem, but adding two is helpful. I suspect that this is related to the fact that sin(x) is an odd function, so adding an even function with a tweakable parameter out front doesn’t do much for your model fit.

By the end, we see the optimal curve beautifully aligning with the true curve, not getting distracted by the noise in the data. Seeing these plots helps give a bit of an intuition about how different techniques penalize complexity and reward goodness of fit to data. I want to eventually add cross validation scores in to these plots as well, to see how they compare to the others.

Bayes and beyond

You have lots of beliefs about the world. Each belief can be written as a propositional statement that is either true or false. But while each statement is either true or false, your beliefs are more complicated; they come in shades of gray, not blacks and whites. Instead of beliefs being on-or-off, we have degrees of beliefs – some beliefs are much stronger than others, some have roughly the same degree of belief, and so on. Your smallest degrees of belief are for true impossibilities – things that you can be absolutely certain are false. Your largest degrees of beliefs are for absolute certainties, the other side of the coin.

Now, answer for yourself the following series of questions:

  1. Can you quantify a degree of belief?

By quantify, I mean put a precise, numerical value on it. That is, can you in principle take any belief of yours, and map it to a real number that represents how strongly you believe it? The in principle is doing a lot of work here; maybe you don’t think that you can in practice do this, but does it make conceptual sense to you to think about degrees of belief as quantities?

If so, then we can arbitrarily scale your degrees of belief by translating them into what I’ll call for the moment credences. All of your credences are on a scale from 0 to 1, where 0 is total disbelief and 1 is totally certain belief. We can accomplish this rescaling by just shifting all your degrees of belief up by your lowest degree of belief (that which you assign to logical impossibilities), and then dividing each degree of belief by the difference between your most distant degrees of belief.

Now,

  1. If beliefs B and B’ are mutually exclusive (i.e. it is impossible for them both to be true), then do you agree that your credence in one of the two of them being true should be the sum of your credences in each individually?

Said more formally, do you agree that if Cr(B & B’) = 0, then Cr(B or B’) = Cr(B) + Cr(B’)? (The equal sign here should be a normative equals sign. We are not asking if you think this is descriptively true of your degrees of beliefs, but if you think that this should be true of your degrees of beliefs. This is the normativity of rationality, by the way, not ethics.)

If so, then your credence function Cr is really a probability function (Cr(B) = P(B)). With just these two questions and the accompanying comments, we’ve pinned down the Kolmogorov axioms for a simple probability space. But we’re not done!

Next,

  1. Do you agree that your credence in two statements B and B’ both being true should be your credence in B’ given that B is true, multiplied by your credence in B?

Formally: Do you agree that P(B & B’) = P (B’ | B) ∙ P(B)? If you haven’t seen this before, this might not seem immediately intuitively obvious. It can be made so quite easily. To find out how strongly you believe both B and B’, you can firstly imagine a world in which B is true and judge your credence in B’ in this scenario, and then secondly judge your actual credence in B being the real world. The conditional probability is important here in order to make sure you are not ignoring possible ways that B and B’ could depend upon each other. If you want to know the chance that both of somebody’s eyes are brown, you need to know (1) how likely it is that their left eye is brown, and (2) how likely it is that their right eye is brown, given that their left eye is brown. Clearly, if we used an unconditional probability for (2), we would end up ignoring the dependency between the colors of the right and left eye.

Still on board? Good! Number 3 is crucially important. You see, the world is constantly offering you up information, and your beliefs are (and should be) constantly shifting in response. We now have an easy way to incorporate these dynamics.

Say that you have some initial credence in a belief B about whether you will experience E in the next few moments. Now you see that after a few moments pass, you did experience E. That is, you discover that B is true. We can now set P(B) equal to 1, and adjust everything else accordingly:

For all beliefs B’, Pnew(B’) = P(B’ | B)

In other words, your new credences are just your old credences given the evidence you received. What if you weren’t totally sure that B is true? Maybe you want P(B) = .99 instead. Easy:

For all beliefs B’: Pnew(B’) = .99 ∙ P(B’ | B) + .01 ∙ P(B’ | ~B)

In other words, your new credence in B’ is just your credence that B is true, multiplied by the conditional credence of B’ given that B is true, added to your credence that B is false times the conditional credence of B’ given that B is false.

We now have a fully specified general system of updating beliefs; that is, we have a mandated set of degrees of beliefs at any moment after some starting point. But what of this starting point? Is there a rationally mandated prior credence to have, before you’ve received any evidence at all? I.e., do we have some a priori favored set of prior degrees of belief?

Intuitively, yes. Some starting points are obviously less rational than others. If somebody starts off being totally certain in the truth of one side of an a posteriori contingent debate that cannot be settled as a matter of logical truth, before receiving any evidence for this side, then they are being irrational. So how best to capture this notion of normative rational priors? This is the question of objective Bayesianism, and there are several candidates for answers.

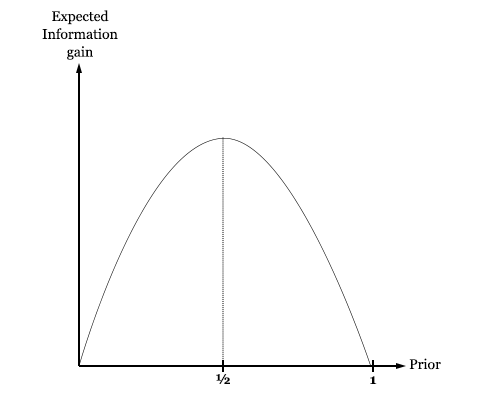
One candidate relies on the notions of surprise and information. Since we start with no information at all, we should start with priors that represent this state of knowledge. That is, we want priors that represent maximum uncertainty. Formalizing this notion gives us the principle of maximum entropy, which says that the proper starting point for beliefs is that which maximizes the entropy function ∑ -P logP.

There are problems with this principle, however, and many complicated debates comparing it to other intuitively plausible principles. The question of objective Bayesianism is far from straightforward.

Putting aside the question of priors, we have a formalized system of rules that mandates the precise way that we should update our beliefs from moment to moment. Some of the mandates seem unintuitive. For instance, it tells us that if we get a positive result on a 99% accurate test for a disease with a 1% prevalence rate, then we have a 50% chance of having the disease, not 99%. There are many known cases where our intuitive judgments of likelihood differ from the judgments that probability theory tells us are rational.

How do we respond to these cases? We only really have a few options. One, we could discard our formalization in favor of the intuitions. Two, we could discard our intuitions in favor of the formalization. Or three, we could accept both, and be fine with some inconsistency in our lives. Presuming that inconsistency is irrational, we have to make a judgment call between our intuitions and our formalization. Which do we discard?

Remember, our formalization is really just the necessary result of the set of intuitive principles we started with. So at the core of it, we’re really just comparing intuitions of differing strengths. If your intuitive agreement with the starting principles was stronger than your intuitive disagreement with the results of the formalization, then presumably you should stick with the formalization.

Another path to adjudicating these cases is to consider pragmatic arguments for our formalization, like Dutch Book arguments that indicate that our way of assigning degrees of beliefs is the only one that is not exploitable by a bookie to ensure losses. You can also be reassured by looking at consistency and convergence theorems, that show the Bayesian’s beliefs converging to the truth in a wide variety of cases.

If you’re still with me, you are now a Bayesian. What does this mean? It means that you think that it is rational to treat your beliefs like probabilities, and that you should update your beliefs by conditioning upon the evidence you receive.

***

So what’s next? Are we done? Have all epistemological issues been solved? Unfortunately not. I think of Bayesianism as a first step into the realm of formal epistemology – a very good first step, but nonetheless still a first. Here’s a simple example of where Bayesianism will lead us into apparent irrationality.

Imagine we have two different beliefs about the world: B1 and B2. B2 is a respectable scientific theory: one that puts its neck out with precise predictions about the results of experiments, and tries to identify a general pattern in the underlying phenomenon. B1 is a “cheating” theory: it doesn’t have any clue what’s going to happen before an experiment, but after an experiment it peeks at the results and pretends that it had predicted it all along. We might think of B1 as the theory that perfectly fits all of the data, but only through over-fitting on the data. As such, B1 is unable to make any good predictions about future data.

What does Bayesianism say about these two theories? Well, consider any single data point. Let’s suppose that B2 does a good job predicting this data point, say, P(D | B2) = 99%. And since B1 perfectly fits the data, P(D | B1) = 1. If our priors in B1 and B2 are written as P1 and P2, respectively, then our credences update as follows:

Pnew(B1) = P(B1 | D) = P1 / (P1 + .99 P2)
Pnew(B2) = P(B2 | D) = .99 P2 / (P1 + .99 P2)

For N similar data points, we get:

Pnew(B1) = P(B1 | Dn) = P1 / (P1 + .99n P2)
Pnew(B2) = P(B2 | Dn) = .99n P2 / (P1 + .99n P2)

What happens to these two credences as n gets larger and larger?

Bayes and beyond

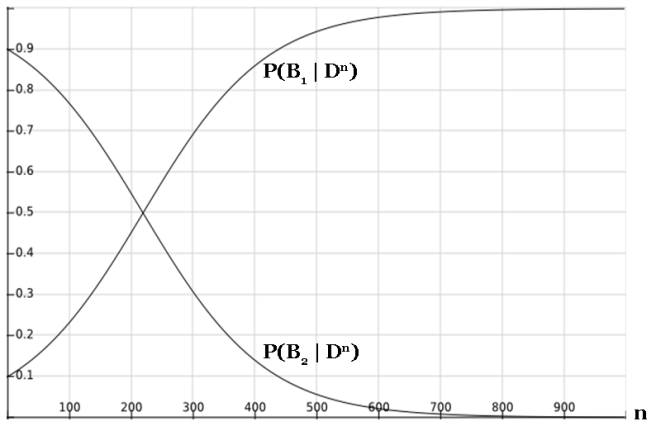
As we can see, our credence in B1 approaches 100% exponentially quickly, and our credence in B2 drops to 0% exponentially quickly. Even if we start with an enormously low prior in B1, our credence will eventually be swamped as we gather more and more data.

It looks like in this example, the Bayesian is successfully hoodwinked by the cheating theory, B1. But this is not quite the end of the story for Bayes. The only single theory that perfectly predicts all of the data you receive in the infinite evidence limit is basically just the theory that “Everything that’s going to happen is what’s going to happen.” And, well, this is surely true. It’s just not very useful.

If instead we look at B1 as a sequence of theories, one for each new data point, then we have a way out by claiming that our priors drop as we go further in the sequence. This is an appeal to simplicity – a theory that exactly specifies 1000 different data points is more complex than a theory that exactly specifies 100 different data points. It also suggests a precise way to formalize simplicity, by encoding it into our priors.

While the problem of over-fitting is not an open-and-shut case against Bayesianism, it should still give us pause. The core of the issue is that there are more intuitive epistemic virtues than those that the Bayesian optimizes for. Bayesianism mandates a degree of belief as a function of two ingredients: the prior and the evidential update. The second of these, Bayesian updating, solely optimizes for accommodation of data. And setting of priors is typically done to optimize for some notion of simplicity. Since empirically distinguishable theories have their priors washed out in the limit of infinite evidence, Bayesianism becomes a primarily accommodating epistemology.

This is what creates the potential for problems of overfitting to arise. The Bayesian is only optimizing for accommodation and simplicity, but what we want is a framework that also optimizes for prediction. I’ll give two examples of ways to do this: cross validation and posterior predictive checking.

I’ve talked about cross validation previously. The basic idea is that you split a set of data into a training set and a testing set, optimize your model for best fit with the training set, and then see how it performs on the testing set. In doing so, you are in essence estimating how well your model will do on predictions of future data points.

This procedure is pretty commonsensical. Want to know how well your model does at predicting data? Well, just look at the predictions it makes and evaluate how accurate they were. It is also completely outside of standard Bayesianism, and solves the issues of overfitting. And since the first half of cross validation is training your model to fit the training set, it is optimizing for both accommodation and prediction.

Posterior predictive checks are also pretty commonsensical; you ask your model to make predictions for future data, and then see how these predictions line up with the data you receive.

More formally, if you have some set of observable variables X and some other set of parameters A that are not directly observable, but that influence the observables, you can express your prior knowledge (before receiving data) as a prior over A, P(A), and a likelihood function P(X | A). Upon receiving some data D about the values of X, you can update your prior over A as follows:

P(A) becomes P(A | D)
where P(A | D) = P(D | A) P(A) / P(D)

To make a prediction about how likely you think it is that the next data point will be X, given the data D, you must use the posterior predictive distribution:

P(X | D) = ∫ P(X | A) ∙ P(A | D) dA

This gives you a precise probability that you can use to evaluate the predictive accuracy of your model.

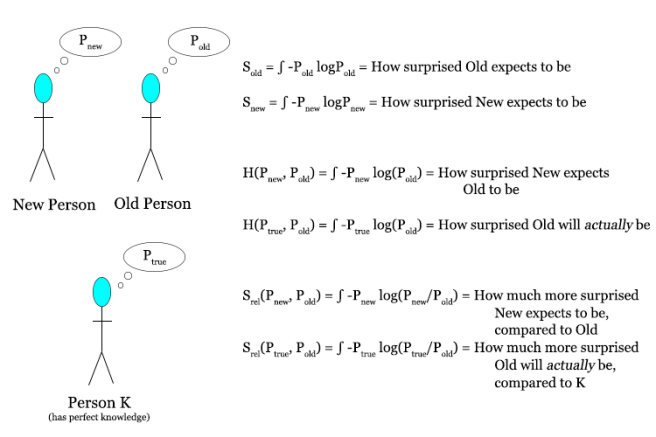
There’s another goal that we can aim towards, besides accommodation, simplicity, or prediction. This is distance from truth. You might think that this is fairly obvious as a goal, and that all the other methods are really only attempts to measure this. But in information theory, there is a precise way in which you can specify the information gap between any given theory and reality. This metric is called the Kullback-Leibler divergence (DKL), and I’ll refer to it as just information divergence.

DKL = ∫ Ptrue log(Ptrue / P) dx

This term, if parsed correctly, represents precisely how much information you gain if you go from your starting distribution P to the true distribution Ptrue.

For example, if you have a fair coin, then the true distribution is given by (Ptrue(H) = .5, Ptrue(T) = .5). You can calculate how far any other theory (P(H) = p, P(T) = 1 – p) is from the truth using DKL.

 DKL = .5 ∙ [ log(1 / 2p) + log(1 / 2(1-p)) ]

I’ve graphed DKL as a function of p here:

Information divergence.png

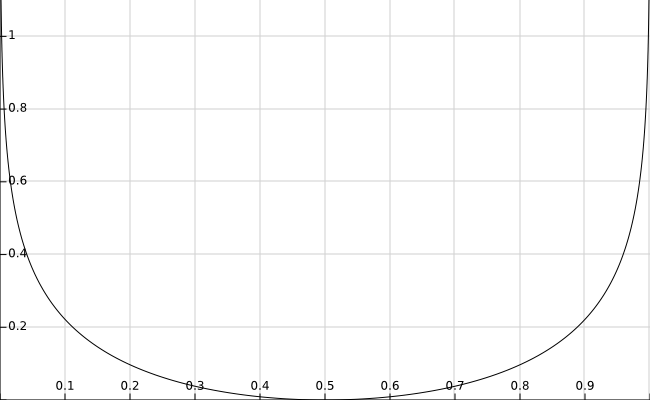
As you can see, the information divergence is 0 for the correct theory that the coin is fair (p = 0.5), and goes to infinity as you get further away from this.

This is all well and good, but how is this practically applicable? It’s easy to minimize the distance from the true distribution if you already know the true distribution, but the problem is exactly that we don’t know the truth and are trying to figure it out.

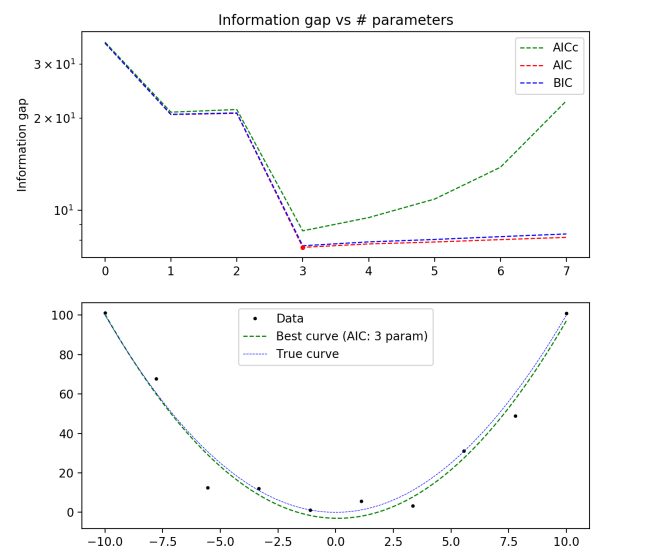
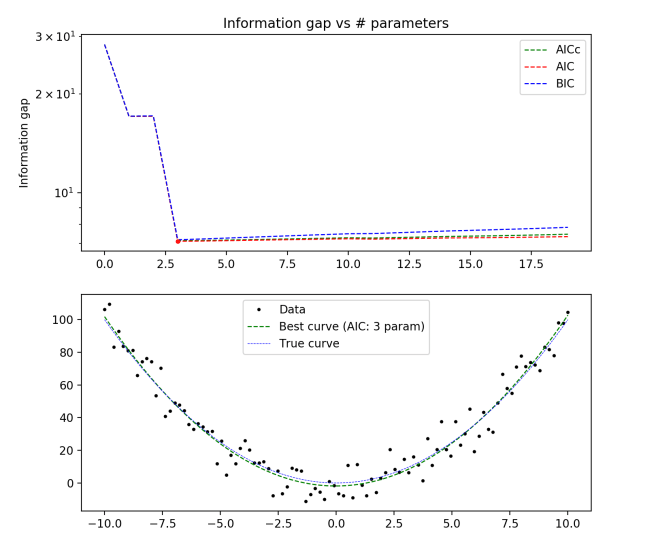
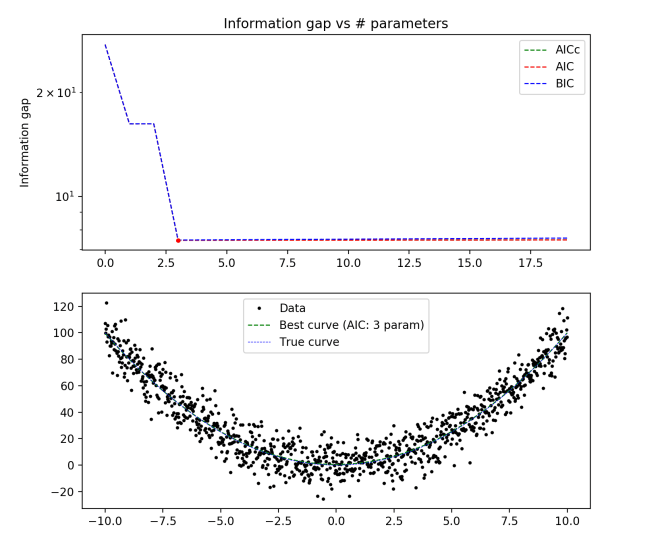
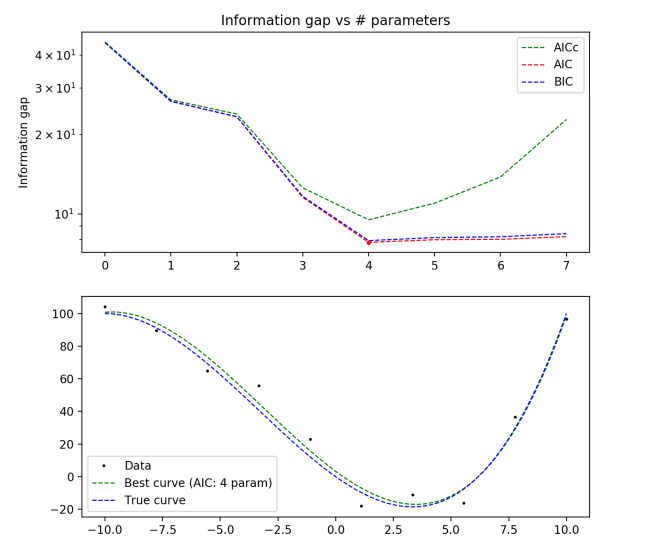
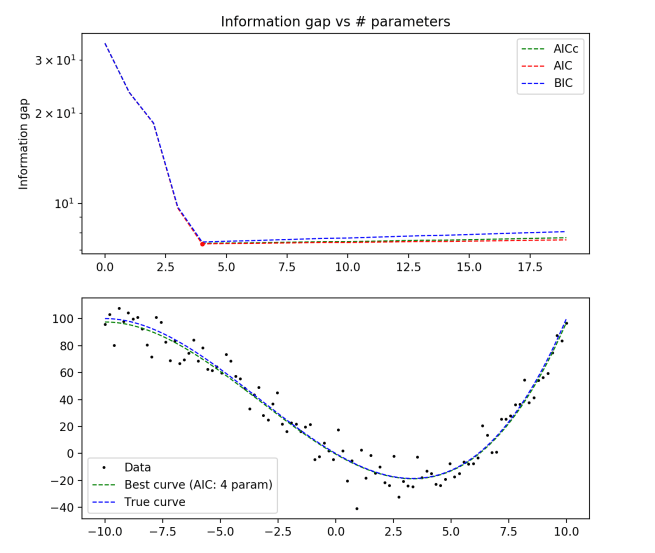
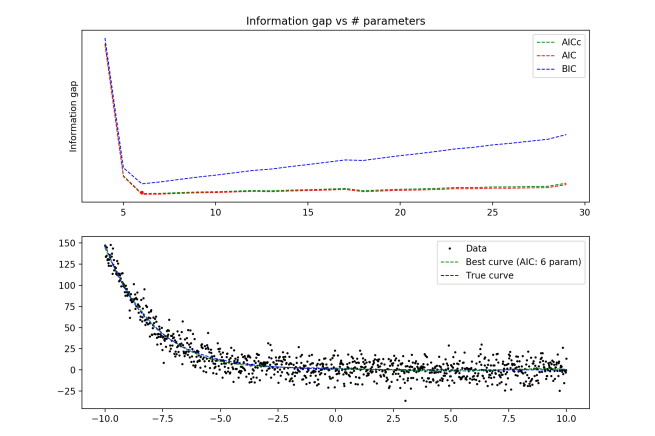
Since we don’t have direct access to Ptrue, we must resort to approximations of DKL. The most famous approximation is called the Akaike information criterion (AIC). I won’t derive the approximation here, but will present the form of this quantity.

AIC = k – log(P(data | M))
where M = the model being evaluated
and k = number of parameters in M

The model that minimizes this quantity probably also minimizes the information distance from truth. Thus, “lower AIC value” serves as a good approximation to “closer to the truth”. Notice that AIC explicitly takes into account simplicity; the quantity k tells you about how complex a model is. This is pretty interesting in it’s own right; it’s not obvious why a method that is solely focused on optimizing for truth will end up explicitly including a term that optimizes for simplicity.

Here’s a summary table describing the methods I’ve talked about here (as well as some others that I haven’t talked about), and what they’re optimizing for.

Goal

Method(s)
Which theory makes the data most likely?

Maximum likelihood estimation (MLE)
p-testing

Which theory is most likely, given the data?

Bayes
Bayesian information criterion (BIC)
Maximum uncertainty

Entropy
Relative entropy

Simplicity

Minimum description length
Solomonoff induction

Predictive accuracy

Cross validation
Posterior predictive checks

Distance from truth

Information divergence (DKL)
Akaike information criterion (AIC)


What is bias?

I find urns to be a fruitful source for metaphors regarding rationality. For example, here’s a question that I’ve recently been thinking about: What does it mean for somebody to be biased?

Imagine that there is an urn containing black and white balls that you don’t have direct access to. You want to know the ratio of white to black balls in the urn, and you know somebody that does have direct access to it. This person will remove some number of balls from the urn and show them to you, thus giving you some evidence as to the contents of the urn.

So, for instance, if this person shows 100 black balls in a row, then this is strong evidence that there are many more black balls in the urn than white balls. Or is it?

In fact, this is only strong evidence if you have good reason to think that the person presenting you with the evidence is unbiased. We can exactly formulate what unbiased means in this example. The procedure your acquaintance is running has two steps: first they remove some balls from the urn, and second they show you some of the balls they removed. Thus there are two sources of bias. I’ll call the first type of bias knowledge bias and the second presentation bias.

Knowledge bias is what happens if the person is not randomly sampling balls from the urn. Maybe they are fishing through the urn until they find a black ball and then removing it. Or maybe for some complicated reason that they are unaware of, their sampling is unrepresentative of the true ratio in the urn. The first of these corresponds to things like motivated reasoning and confirmation bias. The second is more subtle; it corresponds to a bias in terms of the information that they are exposed to. This could come as a result of living in a culture in which certain views are taken for granted and never questioned, or as a result of the information that reaches them being subject to selection pressures that distort the ratio of information on one side to the other. Scott Alexander’s toxoplasma of rage seems like a good example of this.

In short, knowledge bias refers to a state of knowledge where the information that you have is not representative of the information you would get from a random sampling procedure.

Presentation bias is what happens when the balls you are being shown are not a representative sample of the balls that were removed. For example, somebody could have a totally random sampling procedure, and end up removing 10 black balls and 100 white balls, but then only show you the 10 black balls. On the more explicit side, this corresponds to explicitly omitting information or arguments that you know. On the less explicit side, this could correspond to doing a better job at presenting arguments with favorable conclusions than those with unfavorable conclusions. This is pretty hard to avoid in general; it is not easy to do just as good of a job at presenting arguments you dislike as it is for arguments you like.

In short, presentation bias is where the information that is being presented is unrepresentative of a random sampling of the information that the presenter has.

What if all of the good arguments for one side are really complicated and all of the arguments on the other side are dead simple? If you’re talking to a dumb person, you’ll have a hard time conveying the relative strengths of the arguments on either side. In this case, the bias is arising not through the information being presented, but the information that is being received. This is not a presentation bias, but a knowledge bias on the part of the person listening. In this case, a good educator has the choice to either not present the complicated information that their student won’t understand anyway (a presentation bias), or present it and watch it not be understood (a knowledge bias).

Notice that intention is not emphasized in this way of thinking about bias. While intending to present biased information certainly makes it easier to be biased, it is not necessary. Somebody might be biased as a result of not being smart enough, or being surrounded by a biased culture, or being better at making the case for their side than the other.

Bias can get complicated really quickly. Person A, who gets all of their political information from Fox News, probably has a significant knowledge bias. This knowledge bias arises from a presentation bias on the part of Fox News. If Person A presents some arguments they heard on Fox to a friend of theirs, and this friend accepts and updates on those arguments, then they will have unwittingly attained a knowledge bias. This is the case even if there is no presentation bias on the part of Person A!

Basically, bias is contagious. Enter one Super Persuader, somebody who is a master presenter of biased arguments, and bias can propagate like mad throughout a society to the point that it is unclear who and what can be trusted. I’m not sure to what degree it makes sense to say that this is the state of our society today, but it certainly gives reason to be very careful about the way that information is attained and dispersed.

Bayesian experimental design

We can use the concepts in information theory that I’ve been discussing recently to discuss the idea of optimal experimental design. The main idea is that when deciding which experiment to run out of some set of possible experiments, you should choose the one that will generate the maximum information. Said another way, you want to choose experiments that are surprising as possible, since these provide the strongest evidence.

An example!

Suppose that you have a bunch of face-down cups in front of you. You know that there is a ping pong ball underneath one of the cups, and want to discover which one it is. You have some prior distribution of probabilities over the cups, and are allowed to check under exactly one cup. Which cup should you choose in order to get the highest expected information gain?

The answer to this question isn’t extremely intuitively obvious. You might think that you want to choose the cup that you think is most likely to hold the ball, because then you’ll be most likely to find the ball there and thus learn exactly where the ball is. But at the same time, the most likely choice of ball location is also the one that gives you the least information if the ball is actually there. If you were already fairly sure that the ball was under that cup, then you don’t learn much by discovering that it was.

Maybe instead the better strategy is to go for a cup that you think is fairly unlikely to be hiding the ball. Then you’ll have a small chance of finding the ball, but in that case will gain a huge amount of evidence. Or perhaps the maximum expected information gain is somewhere in the middle.

The best way to answer this question is to actually do the calculation. So let’s do it!

First, we’ll label the different theories about the cup containing the ball:

{C1, C2, C3, … CN}

Ck corresponds to the theory that the ball is under the kth cup. Next, we’ll label the possible observations you could make:

{X1, X2, X3, … XN}

Xk corresponds to the observation that the ball is under the kth cup.

Now, our prior over the cups will contain all of our past information about the ball and the cups. Perhaps we thought we heard a rattle when somebody bumped one of the cups earlier, or we notice that the person who put the ball under one of the cups was closer to the cups on the right hand side. All of this information will be contained in the distribution P:

(P1, P2, P3, … PN)

Pk is shorthand for P(Ck) – the probability of Ck being true.

Good! Now we are ready to calculate the expected information gain from any particular observation. Let’s say that we decide to observe X3. There are two scenarios: either we find the ball there, or we don’t.

Scenario 1: You find the ball under cup 3. In this case, you previously had a credence of P3 in X3 being true, so you gain -log(P3) bits of information.

Scenario 2: You don’t find the ball under cup 3. In this case, you gain –log(1 – P3) bits of information.

With probability P3, you gain –log(P3) bits of information, and with probability (1 – P3) you gain –log(1 – P3) bits of information. So your expected information gain is just –P3 logP3 – (1 – P3) logP3.

In general, we see that if you have a prior credence of P in the cup containing the ball, then your expected information gain is:

-P logP – (1 – P) logP

What does this function look like?

Experimental design

We see that it has a peak value at 50%. This means that you expect to gain the most information by looking at a cup that you are 50% sure contains the ball. If you are any more or less confident than this, then evidently you learn less than you would have if you were exactly agnostic about the cup.

Intuitively speaking, this means that we stand to learn the most by doing an experiment on a quantity that we are perfectly agnostic about. Practically speaking, however, the mandate that we run the experiment that maximizes information gain ends up telling us to always test the cup that we are most confident contains the ball. This is because if you split your credences among N cups, they will be mostly under 50%, so the closest you can get to 50% will be the largest credence.

Even if you are 99% confident that the fifteenth cup out of one hundred contains the ball, you will have just about .01% credence in each of the others containing the ball. Since 99% is closer to 50% than .01%, you will stand to gain the most information by testing the fifteenth ball (although you stand to gain very little information in a more absolute sense).

This generalizes nicely. Suppose that instead of trying to guess whether or not there is a ball under a cup, you are trying to guess whether there is a ball, a cube, or nothing. Now your expected information gain in testing a cup is a function of your prior over the cup containing a ball Pball, your prior over it containing a cube Pcube, and your prior over it containing nothing Pempty.

-Pball logPball – Pcube logPcube – Pempty logPempty

Subject to the constraint that these three priors must add up to 1, what set of (Pball, Pcube, Pempy) maximizes the information gain? It is just (⅓, ⅓, ⅓).

Optimal (Pball, Pcube, Pempy) = (⅓, ⅓, ⅓)

Imagine that you know that exactly one cup is empty, exactly one contains a cube, and exactly one contains a ball, and have the following distribution over the cups:

Cup 1: (⅓, ⅓, ⅓)
Cup 2: (⅔, ⅙, ⅙)
Cup 3: (0, ½, ½)

If you can only peek under a single cup, which one should you choose in order to learn the most possible? I take it that the answer to this question is not immediately obvious. But using these methods in information theory, we can answer this question unambiguously: Cup 1 is the best choice – the optimal experiment.

We can even numerically quantify how much more information you get by checking under Cup 1 than by checking under Cup 2:

Information gain(check cup 1) ≈ 1.58 bits
Information gain(check cup 2) ≈ 1.25 bits
Information gain(check cup 3) = 1 bits

Checking cup 1 is thus 0.33 bits better than checking cup 2, and 0.58 bits better than checking cup 3. Since receiving N bits of information corresponds to ruling out all but 1/2N possibilities, we rule out 20.33 ≈ 1.26 times more possibilities by checking cup 1 than cup 2, and 20.58 ≈ 1.5 times more possibilities than cup 3.

Even more generally, we see that when we can test N mutually exclusive characteristics of an object at once, the test is most informative when our credences in the characteristics are smeared out evenly; P(k) = 1/N.

This makes a lot of sense. We learn the most by testing things about which we are very uncertain. The more smeared out our probabilities are over the possibilities, the less confident we are, and thus the more effective a test will be. Here we see a case in which information theory vindicates common sense!

Why relative entropy

Background for this post: Entropy is expected surprise, A survey of entropy and entropy variants, and Maximum Entropy and Bayes

Suppose you have some old distribution Pold, and you want to update it to a new distribution Pnew given some information.

You want to do this in such a way as to be as uncertain as possible, given your evidence. One strategy for achieving this is to maximize the difference in entropy between your new distribution and your old one.

Max (Snew – Sold) = ∑ -Pnew logPnew – ∑ -Pold logPold

Entropy is expected surprise. So this quantity is the new expected surprise minus the old expected surprise. Maximizing this corresponds to trying to be as much more surprised on average as possible than you expected to be previously.

But this is not quite right. We are comparing the degree of surprise you expect to have now to the degree of surprise you expected to have previously, based on your old distribution. But in general, your new distribution may contain important information as to how surprised you should have expected to be.

Think about it this way.

One minute ago, you had some set of beliefs about the world. This set of beliefs carried with it some degree of expected surprise. This expected surprise is not the same as the true average surprise, because you could be very wrong in your beliefs. That is, you might be very confident in your beliefs (i.e. have very low EXPECTED surprise), but turn out to be very wrong (i.e. have very high ACTUAL average surprise).

What we care about is not how surprised somebody with the distribution Pold would have expected to be, but how surprised you now expect somebody with the distribution Pold to be. That is, you care about the average value of surprise, given your new distribution, your new best estimate of the actual distribution

That is to say, instead of using the simple difference in entropies S(Pnew) – S(Pold), you should be using the relative entropy Srel(Pnew, Pold).

Max Srel = ∑ -Pnew logPnew – ∑ -Pnew logPold

Here’s a diagram describing the three species of entropy: entropy, cross entropy, and relative entropy.

Types of Entropy.png

As one more example of why this makes sense: imagine that one minute ago you were totally ignorant and knew absolutely nothing about the world, but were for some reason very irrationally confident about your beliefs. Now you are suddenly intervened upon by an omniscient Oracle that tells you with perfect accuracy exactly what is truly going on.

If your new beliefs are designed by maximizing the absolute gain in entropy, then you will be misled by your old irrational confidence; your old expected surprise will be much lower than it should have been. If you use relative entropy, then you will be using your best measure of the actual average surprise for your old beliefs, which might have been very large. So in this scenario, relative entropy is a much better measure of your actual change in average surprise than the absolute entropy difference, as it avoids being misled by previous irrationality.

A good way to put this is that relative entropy is better because it uses your current best information to estimate the difference in average surprise. While maximizing absolute entropy differences will give you the biggest change in expected surprise, maximizing relative entropy differences will do a better job at giving you the biggest difference in *actual* surprise. Relative entropy, in other words, allows you to correct for previous bad estimates of your average surprise, and substitute in the best estimate you currently have.

These two approaches, maximizing absolute entropy difference and maximizing relative entropy, can give very different answers for what you should believe. It so happens that the answers you get by maximizing relative entropy line up nicely with the answers you get from just ordinary Bayesian updating, while the answers you get by maximizing absolute entropy differences, which is why this difference is important.

A survey of entropy and entropy variants

This post is for anybody that is confused about the numerous different types of entropy concepts out there, and how they relate to one another. The concepts covered are:

  • Surprise
  • Information
  • Entropy
  • Cross entropy
  • KL divergence
  • Relative entropy
  • Log loss
  • Akaike Information Criterion
  • Cross validation

Let’s dive in!

Surprise and information

Previously, I talked about the relationship between surprise and information. It is expressed by the following equation:

Surprise = Information = – log(P)

I won’t rehash the justification for this equation, but highly recommend you check out the previous post if this seems unusual to you.

In addition, we introduced the ideas of expected surprise and total expected surprise, which were expressed by the following equations:

Expected surprise = – P log(P)
Total expected surprise = – ∑ P log(P)

As we saw previously, the total expected surprise for a distribution is synonymous with the entropy of somebody with that distribution.

Which leads us straight into the topic of this post!

Entropy

The entropy of a distribution is how surprised we expect to be if we suddenly learn the truth about the distribution. It is also the amount of information we expect to gain upon learning the truth.

A small degree of entropy means that we expect to learn very little when we hear the truth. A large degree of entropy means that we expect to gain a lot of information upon hearing the truth. Therefore a large degree of entropy represents a large degree of uncertainty. Entropy is our distance from certainty.

Entropy = Total expected surprise = – ∑ P log(P)

Notice that this is not the distance from truth. We can be very certain, and very wrong. In this case, our entropy will be high, because it is our expected surprise. That is, we calculate entropy by looking at the average surprise over our probability distribution, not the true distribution. If we want to evaluate the distance from truth, we need to evaluate the average over the true distribution.

We can do this by using cross-entropy.

Cross Entropy

In general, the cross entropy is a function of two distributions P and Q. The cross entropy of P and Q is the surprise you expect somebody with the distribution Q to have, if you have distribution P.

Cross Entropy = Surprise P expects of Q = – ∑ P log(Q)

The actual average surprise of your distribution P is therefore the cross-entropy between P and the true distribution. It is how surprised somebody would expect you to be, if they had perfect knowledge of the true distribution.

Actual average surprise = – ∑ Ptrue log(P)

Notice that the smallest possible value that the cross entropy could take on is the entropy of the true distribution. This makes sense – if your distribution is as close to the truth as possible, but the truth itself contains some amount of uncertainty (for example, a fundamentally stochastic process), then the best possible state of belief you could have would be exactly as uncertain as the true distribution is. Maximum cross entropy between your distribution and the true distribution corresponds to maximum distance from the truth.

Kullback-Leibler divergence

If we want a quantity that is zero when your distribution is equal to the true distribution, then you can shift the cross entropy H(Ptrue, P) over by the value of the true entropy S(Ptrue). This new quantity H(Ptrue, P) – S(Ptrue) is known as the Kullback-Leibler divergence.

Shifted actual average surprise = Kullback-Leibler divergence
= – ∑ Ptrue log(P) + ∑ Ptrue log(Ptrue)
= ∑ Ptrue log(Ptrue/P)

It represents the information gap, or the actual average difference in difference between your distribution and the true distribution. The smallest possible value of the Kullback-Leibler divergence is zero, when your beliefs are completely aligned with reality.

Since KL divergence is just a constant shift away from cross entropy, minimizing one is the same as minimizing the other. This makes sense; the only real difference between the two is whether we want our measure of “perfect accuracy” to start at zero (KL divergence) or to start at the entropy of the true distribution (cross entropy).

Relative Entropy

The negative KL divergence is just a special case of what’s called relative entropy. The relative entropy of P and Q is just the negative cross entropy of P and Q, shifted so that it is zero when P = Q.

Relative entropy = shifted cross entropy
= – ∑ P log(P/Q)

Since the cross entropy between P and Q measures how surprised P expects Q to be, the relative entropy measures P’s expected gap in average surprisal between themselves and Q.

KL divergence is what you get if you substitute in Ptrue for P. Thus it is the expected gap in average surprisal between a distribution and the true distribution.

Applications

Maximum KL divergence corresponds to maximum distance from the truth, while maximum entropy corresponds to maximum from certainty. This is why we maximize entropy, but minimize KL divergence. The first is about humility – being as uncertain as possible given the information that you possess. The second is about closeness to truth.

Since KL divergence is just a constant shift away from cross entropy, minimizing one is the same as minimizing the other. This makes sense, the only real difference between the two is whether we want our “perfectly accurate” measure to start at zero (KL divergence) or at the entropy of the true distribution (cross entropy).

Since we don’t start off with access to Ptrue, we can’t directly calculate the cross entropy H(Ptrue, P). But lucky for us, a bunch of useful approximations are available!

Log loss

Log loss uses the fact that if we have a set of data D generated by the true distribution, the expected value of F(x) taken over the true distribution will be approximately just the average value of F(x), for x in D.

Cross Entropy = – ∑ Ptrue log(P)
(Data set D, N data points)
Cross Entropy ~ Log loss = – ∑x in D log(P(x)) / N

This approximation should get better as our data set gets larger. Log loss is thus just a large-numbers approximation of the actual expected surprise.

Akaike information criterion

Often we want to use our data set D to optimize our distribution P with respect to some set of parameters. If we do this, then the log loss estimate is biased. Why? Because we use the data in two places: first to optimize our distribution P, and second to evaluate the information distance between P and the true distribution.

This allows problems of overfitting to creep in. A distribution can appear to have a fantastically low information distance to the truth, but actually just be “cheating” by ensuring success on the existing data points.

The Akaike information criterion provides a tweak to the log loss formula to try to fix this. It notes that the difference between the cross entropy and the log loss is approximately proportional to the number of parameters you tweaked divided by the total size of the data set: k/N.

Thus instead of log loss, we can do better at minimizing cross entropy by minimizing the following equation:

AIC = Log loss + k/N

(The exact form of the AIC differs by multiplicative constants in different presentations, which ultimately is unimportant if we are just using it to choose an optimal distribution)

The explicit inclusion of k, the number of parameters in your model, represents an explicit optimization for simplicity.

Cross Validation

The derivation of AIC relies on a complicated set of assumptions about the underlying distribution. These assumptions limit the validity of AIC as an approximation to cross entropy / KL divergence.

But there exists a different set of techniques that rely on no assumptions besides those used in the log loss approximation (the law of large numbers and the assumption that your data is an unbiased sampling of the true distribution). Enter the holy grail of model selection!

The problem, recall, was that we used the same data twice, allowing us to “cheat” by overfitting. First we used it to tweak our model, and second we used it to evaluate our model’s cross entropy.

Cross validation solves this problem by just separating the data into two sets, the training set and the testing set. The training set is used for tweaking your model, and the testing set is used for evaluating the cross entropy. Different procedures for breaking up the data result in different flavors of cross-validation.

There we go! These are some of the most important concepts built off of entropy and variants of entropy.

Entropy is expected surprise

Today we’re going to talk about a topic that’s very close to my heart: entropy. We’ll start somewhere that might seem unrelated: surprise.

Suppose that we wanted to quantify the intuitive notion of surprise. How should we do that?

We’ll start by analyzing a few base cases.

First! If something happens and you already were completely certain that it would happen, then you should completely unsurprised.

That is, if event E happens, and you had a credence P(E) = 100% in it happening, then your surprise S should be zero.

S(1) = 0

Second! If something happens that you were totally sure was impossible, with 100% credence, then you should be infinitely surprised.

That is, if E happens and P(E) = 0, then S = ∞.

S(0) = ∞

So far, it looks like your surprise S should be a function of your credence P in the event you are surprised at. That is, S = S(P). We also have the constraints that S(1) = 0 and S(0) = ∞.

There are many candidates for a function like this, for example: S(P) = 1/P – 1, S(P) = -log(P), S(P) = cot(πx/2). So we need more constraints.

Third! If an event E1 happens that is surprising to degree S1, and then another event E2 happens with surprisingness S2, then your surprise at the combination of these events should be S1 + S2.

I.e., we want surprise to be additive. If S(P(E1)) = S1 and S(P(E2 | E1)) = S2, then S(P(E1 & E2) = S1 + S2.

This entails a new constraint on our surprise function, namely:

S(PQ) = S(P) + S(Q)

Fourth, and finally! We want our surprise function to be continuous – free from discontinuous jumps. If your credence that the event will happen changes by an arbitrarily small amount, then your surprise if it does happen should also change by an arbitrarily small amount.

S(P) is continuous.

These four constraints now fully specify the form of our surprise function, up to a multiplicative constant. What we find is that the only function satisfying these constraints is the logarithm:

S(P) = k logP, where k is some negative number

Taking the simplest choice of k, we end up with a unique formalization of the intuitive notion of surprise:

S(P) = – logP

To summarize what we have so far: Four basic desideratum for our formalization of the intuitive notion of surprise have led us to a single simple equation.

This equation that we’ve arrived at turns out to be extremely important in information theory. It is, in fact, just the definition of the amount of information you gain by observing E. This reveals to us a deep connection between surprise and information. They are in an important sense expressing the same basic idea: more surprising events give you more information, and unsurprising events give you little information.

Let’s get a little better numerical sense of this formalization of surprise/information. What does a single unit of surprise or information mean? With some quick calculation, we see that a single unit of surprise, or bit of information corresponds to the observation of an event that you had a 50% expectation of. This also corresponds to a ruling out of 50% of the weight of possible other events you thought you might have observed. In essence, each bit of information you receive / surprise you experience corresponds to the total amount of possibilities being cut in half.

Two bits of information narrow the possibilities to one-fourth. Three cut out all but one-eighth. And so on. For a rational agent, the process of receiving more information or of being continuously surprised is the process of whittling down your models of reality to a smaller and better set!

The next great step forward is to use our formalization of surprise to talk not just about how surprised you are once an event happens, but how surprised you expect to be. If you have a credence of P in an event happening, then you expect a degree of surprise S(P) with credence P. In other words, the expected surprise you have with respect to that particular event is:

Expected surprise = – P logP

When summed over the totality of all possible events that occurred we get the following expression:

Total expected surprise = – ∑i Pi logPi

This expression should look very very familiar to you. It’s one of the most important quantities humans have discovered…

ENTROPY!!

Now you understand the title of this post. Quite literally, entropy is total expected surprise!

Entropy = Total expected surprise

By the way, you might be wondering if this is the same entropy as you hear mentioned in the context of physics (that thing that always increases). Yes, it is identical! This means that we can describe the Second Law of Thermodynamics as a conspiracy by the universe to always be as surprising as possible to us! There are a bunch of ways to explore the exact implications of this, but that’s a subject for another post.

Getting back to the subject of this post, we can now make another connection. Surprise is information. Total expected surprise is entropy. And entropy is a measure of uncertainty.

If you think about this for a moment, this should start to make sense. If your model of reality is one in which you expect to be very surprised in the next moment, then you are very uncertain about what is going to happen in the next moment. If, on the other hand, your model of reality is one in which you expect zero surprise in the next moment, then you are completely certain!

Thus we see the beautiful and deep connection between surprise, information, entropy, and uncertainty. The overlap of these four concepts is rich with potential for exploration. We could go the route of model selection and discuss notions like mutual informationinformation divergence, and relative entropy, and how they relate to the virtues of predictive accuracy and model simplicity. We could also go the route of epistemology and discuss the notion of epistemic humility, choosing your beliefs to maximize your uncertainty, and the connection to Bayesian epistemology. Or, most tantalizingly, we could go the route of physics and explore the connection between this highly subjective sense of entropy as surprise/ uncertainty, and the very concrete notion of entropy as a physical quantity that characterizes the thermal properties of systems.

Instead of doing any of these, I’ll do none, and end here in hope that I’ve conveyed some of the coolness of this intersection of philosophy, statistics, and information theory.