Many people have heard of Mandelbrot’s famous set. But far fewer have heard of its older sibling: the Buddhabrot. I find this object even more beautiful than the Mandelbrot set, and want to give it its proper appreciation here.
To start out with: What is the Mandelbrot set? It is defined as the set of complex values c that stay finite under arbitrary many repeated applications of the function fc(z) = z2 + c (where the first iteration is applied to z = 0).
So, for example, to check if the number 2 is in the Mandelbrot set, we just look at what happens when we plug in 0 to the function f2 and repeat:
0 becomes 02 + 2 = 2
2 becomes 22 + 2 = 6
6 becomes 62 + 2 = 38
38 becomes 382 + 2 = something large, and on and on.
You can probably predict that as we keep iterating, we’re going to eventually run off to infinity. So 2 is not in the set.
On the other hand, see what happens when we plug in -1:
0 becomes 02 + (-1) = -1
-1 becomes (-1)2 + (-1) = 0
0 becomes -1
-1 becomes 0
… and so on to infinity
With -1, we just bounce around back and forth between 0 and -1, so we clearly never diverge to infinity.
Now we can draw the elements of this set pretty easily, by simply shading in the numbers on the complex plane that are in the set. If you do so, you get the following visualization:

Cool! But what about all those colorful visualizations you’ve probably seen? (maybe even on this blog!)
Well, whether you’re in the Mandelbrot set or not is just a binary property. So by itself the Mandelbrot set doesn’t have a rich enough structure to account for all those pretty colors. What’s being visualized in those pictures is not just whether an element is in the Mandelbrot set, but also, if it’s not in the set (i.e. if the 0 diverges to infinity upon repeated applications of fc), how quickly it leaves the set!
In other words, the colors are a representation of how not in the set numbers are. There are some complex numbers that exist near the edge of the Mandelbrot that hang around the set for many many iterations before finally blowing up and running off to infinity. And these numbers will be colored differently from, say, the number “2”, which right away starts blowing up.
And that’s how you end up with pictures like the following:
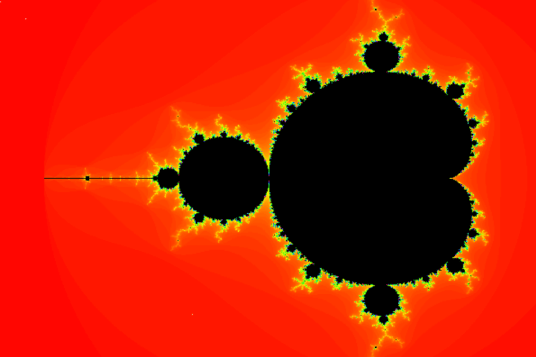
Now, what if instead of visualizing how in the set various complex numbers are, we instead look at what complex numbers are most visited on average when running through Mandelbrot iterations? Well, that’s how we get the Buddhabrot!
Specifically, here’s a procedure we could run:
- Choose a random complex number c.
- Define z = 0
- Update: z = fc(z)
- Give one unit of credit to whatever complex number z is now.
- Repeat 3 and 4 for some fixed number of iterations.
- Start over back at 1 with a new complex number.
As you run this algorithm, you can visualize the results by giving complex numbers with more credits brighter colors. And as you do this, a curious figure begins to appear on the (rotated) complex plane:

That’s right, Buddha is hanging out on the complex plane, hiding in the structure of the Mandelbrot set!